Popular, Inc. (BPOP): Price and Financial Metrics
GET POWR RATINGS... FREE!
BPOP POWR Grades
- Value is the dimension where BPOP ranks best; there it ranks ahead of 90.84% of US stocks.
- BPOP's strongest trending metric is Momentum; it's been moving up over the last 179 days.
- BPOP ranks lowest in Growth; there it ranks in the 25th percentile.
BPOP Stock Summary
- Popular Inc's stock had its IPO on March 26, 1990, making it an older stock than 84.38% of US equities in our set.
- With a price/earnings ratio of 7.28, Popular Inc P/E ratio is greater than that of about only 14.26% of stocks in our set with positive earnings.
- Equity multiplier, or assets relative to shareholders' equity, comes in at 12.2 for Popular Inc; that's greater than it is for 95.16% of US stocks.
- If you're looking for stocks that are quantitatively similar to Popular Inc, a group of peers worth examining would be BOKF, UMPQ, ABCB, NBTB, and FLO.
- BPOP's SEC filings can be seen here. And to visit Popular Inc's official web site, go to www.popular.com.
BPOP Valuation Summary
- BPOP's price/sales ratio is 2.4; this is 100% higher than that of the median Financial Services stock.
- BPOP's price/sales ratio has moved down 0.8 over the prior 243 months.
Below are key valuation metrics over time for BPOP.
Stock | Date | P/S | P/B | P/E | EV/EBIT |
---|---|---|---|---|---|
BPOP | 2018-04-18 | 2.7 | 0.9 | 42.1 | 2.2 |
BPOP | 2011-06-20 | 1.6 | 0.8 | 72.2 | 26.8 |
BPOP | 2010-10-11 | 3.1 | 0.8 | 56.2 | 137.7 |
BPOP | 2007-08-29 | 1.9 | 0.9 | 10.6 | 46.7 |
BPOP | 2003-06-30 | 3.3 | 1.9 | 14.2 | 33.8 |
BPOP | 2002-01-07 | 3.0 | 1.7 | 13.5 | 29.5 |
BPOP Growth Metrics
- The 2 year net cashflow from operations growth rate now stands at 13.52%.
- Its 5 year net cashflow from operations growth rate is now at -15.37%.
- Its 5 year net income to common stockholders growth rate is now at -40.78%.

The table below shows BPOP's growth in key financial areas (numbers in millions of US dollars).
Date | Revenue | Operating Cash Flow | Net Income to Common Stock |
---|---|---|---|
2021-12-31 | 2,793.182 | 1,005.158 | 933.477 |
2021-09-30 | 2,689.417 | 885.156 | 903.689 |
2021-06-30 | 2,540.243 | 850.518 | 823.992 |
2021-03-31 | 2,381.373 | 676.19 | 733.541 |
2020-12-31 | 2,076.389 | 678.772 | 504.864 |
2020-09-30 | 2,053.759 | 658.109 | 494.825 |
BPOP's Quality Factors
The “Quality” component of the POWR Ratings focuses on 31 different factors of a companies fundamentals and operational strength. Here are some key insights as we drill into the specifics of these quality attributes.- BPOP has a Quality Grade of C, ranking ahead of 37.86% of graded US stocks.
- BPOP's asset turnover comes in at 0.037 -- ranking 236th of 431 Banking stocks.
- PEBK, BMRC, and LKFN are the stocks whose asset turnover ratios are most correlated with BPOP.
The table below shows BPOP's key quality metrics over time.
Period | Asset Turnover | Gross Margin | ROIC |
---|---|---|---|
2021-06-30 | 0.037 | 1 | 0.019 |
2021-03-31 | 0.036 | 1 | 0.017 |
2020-12-31 | 0.034 | 1 | 0.012 |
2020-09-30 | 0.035 | 1 | 0.011 |
2020-06-30 | 0.038 | 1 | 0.012 |
2020-03-31 | 0.041 | 1 | 0.013 |
BPOP Price Target
For more insight on analysts targets of BPOP, see our BPOP price target page. And for a list of of all stocks sorted by upside potential based on analyst target price, see our Top Price Target page.
Average Price Target | $89.75 | Average Broker Recommendation | 1.38 (Strong Buy) |
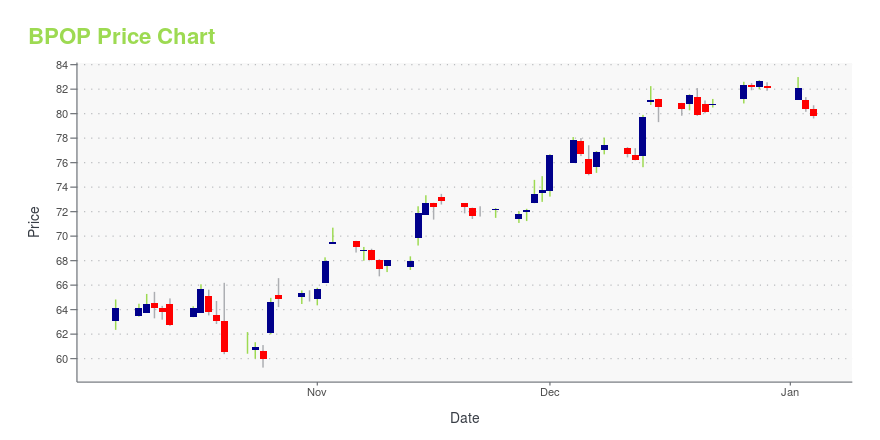
BPOP Stock Price Chart Interactive Chart >
BPOP Price/Volume Stats
Current price | $77.31 | 52-week high | $99.49 |
Prev. close | $76.93 | 52-week low | $68.31 |
Day low | $76.28 | Volume | 166,053 |
Day high | $78.08 | Avg. volume | 672,617 |
50-day MA | $79.20 | Dividend yield | 2.86% |
200-day MA | $82.55 | Market Cap | 5.91B |
Popular, Inc. (BPOP) Company Bio
Popular Inc. provides various retail and commercial banking products and services primarily to institutional and retail customers in Puerto Rico and the U.S. The company was founded in 1893 and is based in Hato Rey, Puerto Rico.
Latest BPOP News From Around the Web
Below are the latest news stories about Popular Inc that investors may wish to consider to help them evaluate BPOP as an investment opportunity.
Cohen & Steers (CNS) Rewards Shareholders With Dividend HikeCohen & Steers (CNS) announces a quarterly dividend of 55 cents per share, representing a hike of 22.2% from the prior payout of 45 cents. |
Golar LNG Limited and American Woodmark have been highlighted as Zacks Bull and Bear of the DayGolar LNG Limited and American Woodmark have been highlighted as Zacks Bull and Bear of the Day. |
Popular Enters into Agreement to Acquire Key Customer Channels; Renegotiates Existing Commercial Contracts with EvertecSAN JUAN, Puerto Rico, February 24, 2022--Popular, Inc. ("Popular" or the "Corporation") (NASDAQ: BPOP) announced today its entry, along with its wholly owned subsidiary, Banco Popular de Puerto Rico ("BPPR"), into a definitive agreement with Evertec, Inc. ("Evertec") and Evertec Group, LLC, a wholly owned subsidiary of Evertec, to acquire assets and assume liabilities used by Evertec to service certain BPPR channels. Popular expects the acquisition will accelerate the Corporation’s ongoing digi |
Popular, Inc. to Participate in the RBC Capital Markets 2022 Financial Institutions ConferenceSAN JUAN, Puerto Rico, February 24, 2022--Popular, Inc. (NASDAQ: BPOP) announced today that it will participate in the upcoming RBC Capital Markets Financial Institutions Conference which will be held virtually on Wednesday March 9, 2022. Carlos J. Vázquez, Executive Vice President and Chief Financial Officer of Popular, Inc., will speak at 10:00 a.m. Eastern Time. |
Is Popular (BPOP) Stock Worth Buying on 25% Dividend Hike?Popular (BPOP) announces a 25% hike in the quarterly dividend. Is the stock worth betting on to earn this increased dividend? |
BPOP Price Returns
1-mo | -4.40% |
3-mo | -3.85% |
6-mo | -4.48% |
1-year | 3.97% |
3-year | 54.44% |
5-year | 112.08% |
YTD | -4.48% |
2021 | 49.06% |
2020 | 0.00% |
2019 | 27.21% |
2018 | 35.80% |
2017 | -16.87% |
BPOP Dividends
Ex-Dividend Date | Type | Payout Amount | Change | ||||||
---|---|---|---|---|---|---|---|---|---|
Loading, please wait... |
Continue Researching BPOP
Want to see what other sources are saying about Popular Inc's financials and stock price? Try the links below:Popular Inc (BPOP) Stock Price | Nasdaq
Popular Inc (BPOP) Stock Quote, History and News - Yahoo Finance
Popular Inc (BPOP) Stock Price and Basic Information | MarketWatch
Loading social stream, please wait...