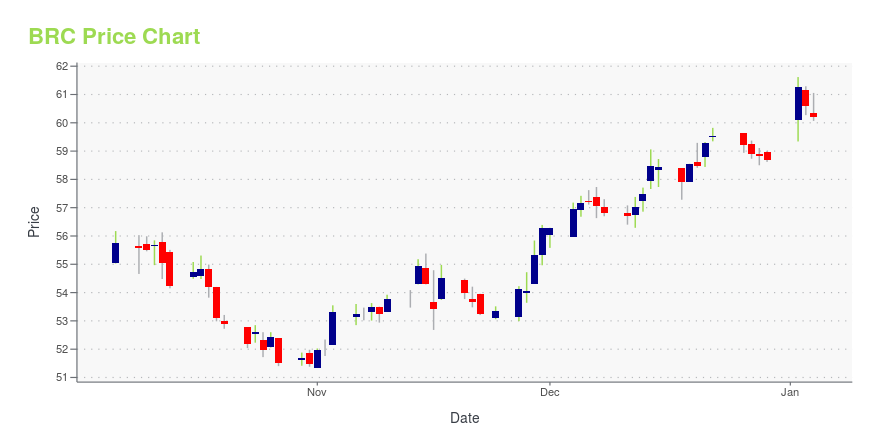
Brady Corporation (BRC): Price and Financial Metrics
BRC Price/Volume Stats
Current price | $56.28 | 52-week high | $58.20 |
Prev. close | $56.27 | 52-week low | $44.71 |
Day low | $55.58 | Volume | 333,047 |
Day high | $56.29 | Avg. volume | 379,798 |
50-day MA | $54.09 | Dividend yield | 1.74% |
200-day MA | $51.91 | Market Cap | 2.72B |
BRC Stock Price Chart Interactive Chart >
BRC POWR Grades
- Quality is the dimension where BRC ranks best; there it ranks ahead of 98.66% of US stocks.
- BRC's strongest trending metric is Growth; it's been moving up over the last 177 days.
- BRC ranks lowest in Momentum; there it ranks in the 21st percentile.
BRC Stock Summary
- BRC's went public 37.89 years ago, making it older than 93.05% of listed US stocks we're tracking.
- With a year-over-year growth in debt of -37.54%, BRADY CORP's debt growth rate surpasses only 8.57% of about US stocks.
- In terms of volatility of its share price, BRC is more volatile than merely 4.93% of stocks we're observing.
- If you're looking for stocks that are quantitatively similar to BRADY CORP, a group of peers worth examining would be PLPC, ORGO, CW, JOUT, and IART.
- BRC's SEC filings can be seen here. And to visit BRADY CORP's official web site, go to www.bradyid.com.
BRC Valuation Summary
- In comparison to the median Industrials stock, BRC's price/earnings ratio is 25.76% lower, now standing at 14.7.
- BRC's price/sales ratio has moved up 0.4 over the prior 243 months.
Below are key valuation metrics over time for BRC.
Stock | Date | P/S | P/B | P/E | EV/EBIT |
---|---|---|---|---|---|
BRC | 2023-11-09 | 1.9 | 2.6 | 14.7 | 10.9 |
BRC | 2023-11-08 | 1.9 | 2.6 | 14.8 | 11.0 |
BRC | 2023-11-07 | 1.9 | 2.6 | 14.7 | 10.9 |
BRC | 2023-11-06 | 1.9 | 2.6 | 14.7 | 10.9 |
BRC | 2023-11-03 | 1.9 | 2.6 | 14.7 | 10.9 |
BRC | 2023-11-02 | 1.9 | 2.5 | 14.4 | 10.7 |
BRC Growth Metrics
- Its 4 year net income to common stockholders growth rate is now at 26.96%.
- Its year over year net cashflow from operations growth rate is now at -42%.
- Its year over year price growth rate is now at -13.11%.

The table below shows BRC's growth in key financial areas (numbers in millions of US dollars).
Date | Revenue | Operating Cash Flow | Net Income to Common Stock |
---|---|---|---|
2022-09-30 | 1,303.156 | 118.957 | 154.374 |
2022-06-30 | 1,302.062 | 118.449 | 149.979 |
2022-03-31 | 1,284.211 | 115.993 | 136.942 |
2021-12-31 | 1,241.163 | 131.104 | 134.179 |
2021-09-30 | 1,188.946 | 170.318 | 131.224 |
2021-06-30 | 1,144.698 | 205.665 | 129.659 |
BRC Price Target
For more insight on analysts targets of BRC, see our BRC price target page. And for a list of of all stocks sorted by upside potential based on analyst target price, see our Top Price Target page.
Average Price Target | $67.00 | Average Broker Recommendation | 1.5 (Moderate Buy) |
Brady Corporation (BRC) Company Bio
Brady Corporation manufactures and supplies identification solutions, specialty materials, and workplace safety products that identify and protect premises, products, and people in the United States and internationally. The company was founded in 1914 and is based in Milwaukee, Wisconsin.
Latest BRC News From Around the Web
Below are the latest news stories about BRADY CORP that investors may wish to consider to help them evaluate BRC as an investment opportunity.
Brady Corporation (NYSE:BRC) Q1 2024 Earnings Call TranscriptBrady Corporation (NYSE:BRC) Q1 2024 Earnings Call Transcript November 18, 2023 Operator: Good day and thank you for standing by. Welcome to Brady Corporation’s First Quarter 2024 Earnings Conference Call. At this time, all participants are in a listen-only mode. After the presentation, there will be a question-and-answer session. [Operator Instructions] Please be advised that […] |
Brady (NYSE:BRC) Is Paying Out A Dividend Of $0.235Brady Corporation ( NYSE:BRC ) has announced that it will pay a dividend of $0.235 per share on the 31st of January... |
Q1 2024 Brady Corp Earnings CallQ1 2024 Brady Corp Earnings Call |
Brady Corp (BRC) Reports Growth in Sales and Earnings for Q1 Fiscal 2024Organic Sales and Gross Profit Margin Rise as Company Delivers Strong Quarterly Results |
Brady Corporation Reports Fiscal 2024 First Quarter ResultsSales for the quarter increased 2.9 percent. Organic sales increased 2.7 percent.Gross profit margin increased to 51.7 percent in the first quarter of fiscal 2024 compared to 48.1 percent in the first quarter of fiscal 2023.Diluted EPS increased 22.8 percent to $0.97 in the first quarter of fiscal 2024 compared to $0.79 in the same quarter of the prior year. Diluted EPS Excluding Certain Items* increased 19.0 percent to $1.00 in the first quarter of fiscal 2024 compared to $0.84 in the same quar |
BRC Price Returns
1-mo | 8.27% |
3-mo | 11.26% |
6-mo | 15.22% |
1-year | 19.49% |
3-year | 32.42% |
5-year | 41.48% |
YTD | 21.70% |
2022 | -10.91% |
2021 | 3.75% |
2020 | -6.00% |
2019 | 34.11% |
2018 | 17.14% |
BRC Dividends
Ex-Dividend Date | Type | Payout Amount | Change | ||||||
---|---|---|---|---|---|---|---|---|---|
Loading, please wait... |
Continue Researching BRC
Here are a few links from around the web to help you further your research on Brady Corp's stock as an investment opportunity:Brady Corp (BRC) Stock Price | Nasdaq
Brady Corp (BRC) Stock Quote, History and News - Yahoo Finance
Brady Corp (BRC) Stock Price and Basic Information | MarketWatch
Loading social stream, please wait...