Berkshire Hathaway Inc. New (BRK.B): Price and Financial Metrics
BRK.B Price/Volume Stats
Current price | $408.41 | 52-week high | $430.00 |
Prev. close | $408.13 | 52-week low | $293.39 |
Day low | $406.00 | Volume | 3,778,500 |
Day high | $410.60 | Avg. volume | 3,653,130 |
50-day MA | $391.77 | Dividend yield | N/A |
200-day MA | $360.90 | Market Cap | 882.46B |
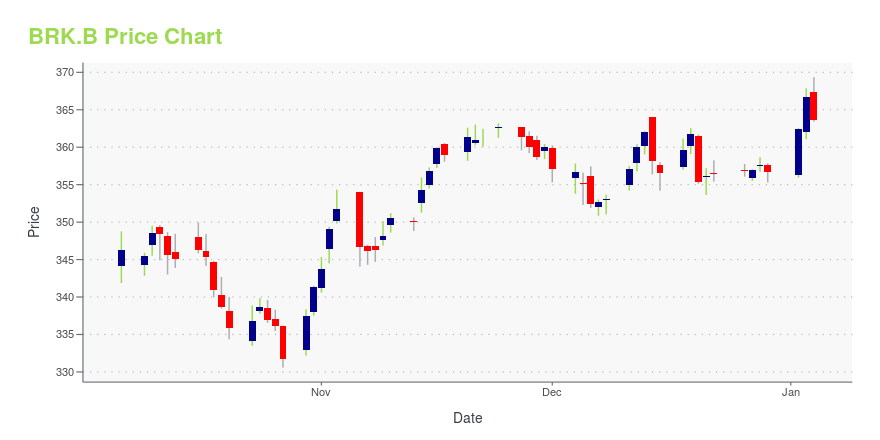
BRK.B Stock Price Chart Interactive Chart >
BRK.B POWR Grades
- BRK.B scores best on the Sentiment dimension, with a Sentiment rank ahead of 90.84% of US stocks.
- The strongest trend for BRK.B is in Stability, which has been heading down over the past 26 weeks.
- BRK.B's current lowest rank is in the Growth metric (where it is better than 0.82% of US stocks).
BRK.B Stock Summary
- BRK.B has a higher market value than 99.85% of US stocks; more precisely, its current market capitalization is $798,357,323,184.
- In terms of twelve month growth in earnings before interest and taxes, BERKSHIRE HATHAWAY INC is reporting a growth rate of -20,512.32%; that's higher than merely 0.05% of US stocks.
- The volatility of BERKSHIRE HATHAWAY INC's share price is greater than that of merely 3.28% US stocks with at least 200 days of trading history.
- Stocks that are quantitatively similar to BRK.B, based on their financial statements, market capitalization, and price volatility, are TSLA, META, UNH, JPM, and LLY.
- BRK.B's SEC filings can be seen here. And to visit BERKSHIRE HATHAWAY INC's official web site, go to www.berkshirehathaway.com.
BRK.B Valuation Summary
- BRK.B's EV/EBIT ratio is 8.8; this is 26.36% lower than that of the median Financial Services stock.
- Over the past 243 months, BRK.B's EV/EBIT ratio has gone down 2.2.
Below are key valuation metrics over time for BRK.B.
Stock | Date | P/S | P/B | P/E | EV/EBIT |
---|---|---|---|---|---|
BRK.B | 2023-12-22 | 1.9 | 1.5 | 10.1 | 8.8 |
BRK.B | 2023-12-21 | 1.9 | 1.5 | 10.1 | 8.7 |
BRK.B | 2023-12-20 | 1.9 | 1.5 | 10.1 | 8.7 |
BRK.B | 2023-12-19 | 2.0 | 1.5 | 10.3 | 8.9 |
BRK.B | 2023-12-18 | 1.9 | 1.5 | 10.2 | 8.8 |
BRK.B | 2023-12-15 | 1.9 | 1.5 | 10.1 | 8.8 |
BRK.B Growth Metrics
- Its 3 year price growth rate is now at 49.27%.
- The 2 year price growth rate now stands at 78.81%.
- Its 2 year net income to common stockholders growth rate is now at 734.61%.
The table below shows BRK.B's growth in key financial areas (numbers in millions of US dollars).
Date | Revenue | Operating Cash Flow | Net Income to Common Stock |
---|---|---|---|
2022-09-30 | 253,887 | 34,818 | -1,337 |
2022-06-30 | 265,922 | 35,223 | 11,695 |
2022-03-31 | 353,169 | 36,944 | 83,544 |
2021-12-31 | 354,636 | 39,421 | 89,795 |
2021-09-30 | 346,046 | 42,172 | 85,984 |
2021-06-30 | 365,148 | 41,866 | 105,777 |
BRK.B's Quality Factors
The “Quality” component of the POWR Ratings focuses on 31 different factors of a companies fundamentals and operational strength. Here are some key insights as we drill into the specifics of these quality attributes.- BRK.B has a Quality Grade of C, ranking ahead of 41.28% of graded US stocks.
- BRK.B's asset turnover comes in at 0.417 -- ranking 34th of 133 Insurance stocks.
- ANAT, MKL, and ORI are the stocks whose asset turnover ratios are most correlated with BRK.B.
The table below shows BRK.B's key quality metrics over time.
Period | Asset Turnover | Gross Margin | ROIC |
---|---|---|---|
2021-06-30 | 0.417 | 0.443 | 0.162 |
2021-03-31 | 0.433 | 0.470 | 0.169 |
2020-12-31 | 0.352 | 0.330 | 0.076 |
2020-09-30 | 0.349 | 0.307 | 0.067 |
2020-06-30 | 0.330 | 0.256 | 0.046 |
2020-03-31 | 0.303 | 0.161 | 0.022 |
BRK.B Price Target
For more insight on analysts targets of BRK.B, see our BRK.B price target page. And for a list of of all stocks sorted by upside potential based on analyst target price, see our Top Price Target page.
Average Price Target | $328.00 | Average Broker Recommendation | 1.62 (Moderate Buy) |
Berkshire Hathaway Inc. New (BRK.B) Company Bio
Berkshire Hathaway, Inc. is a publicly owned investment manager. Through its subsidiaries, the firm primarily engages in the insurance and reinsurance of property and casualty risks business. Berkshire Hathaway was founded in 1889 and is based in Omaha, Nebraska.
Latest BRK.B News From Around the Web
Below are the latest news stories about BERKSHIRE HATHAWAY INC that investors may wish to consider to help them evaluate BRK.B as an investment opportunity.
3 Stocks That Hedge Funds Are Abandoning in DrovesStructural shifts in the financial markets have led to interesting strategic shifts among hedge fund managers. |
Can Archer Aviation Stock Fly Higher in 2024?If you invested in Archer Aviation in January, your bet on ACHR stock has done well. |
7 Stocks with Strong Insider Buying: December 2023Stocks with strong insider buying should make you curious, and finding them can be a useful shortcut for your research |
Buy Apple Stock in the Down Months. You’ll Be Glad You Did.Apple stock is now worth as much as the French stock market. |
Don’t Fall for GameStop ‘Good News.’ GME Stock Is Still Doomed.With GME stock, an earnings beat and a possible transformation into an investment vehicle aren't enough to counter a rich valuation. |
BRK.B Price Returns
1-mo | 0.60% |
3-mo | 12.88% |
6-mo | 11.34% |
1-year | 39.15% |
3-year | 62.72% |
5-year | 100.92% |
YTD | 14.51% |
2023 | 15.46% |
2022 | 3.31% |
2021 | 28.95% |
2020 | 2.37% |
2019 | 10.93% |
Continue Researching BRK.B
Here are a few links from around the web to help you further your research on Berkshire Hathaway Inc's stock as an investment opportunity:Berkshire Hathaway Inc (BRK.B) Stock Price | Nasdaq
Berkshire Hathaway Inc (BRK.B) Stock Quote, History and News - Yahoo Finance
Berkshire Hathaway Inc (BRK.B) Stock Price and Basic Information | MarketWatch
Loading social stream, please wait...