Brixmor Property Group Inc. (BRX): Price and Financial Metrics


Brixmor Property Group Inc. (BRX): $20.49

0.48 (+2.40%)

POWR Rating

Component Grades

Growth

S

Value

I

Momentum

G

Stability

N

Sentiment

U

Quality

P

Add BRX to Watchlist
Sign Up

Industry: REITs - Retail


Ranked

of

in industry

BRX POWR Grades

  • Sentiment is the dimension where BRX ranks best; there it ranks ahead of 94.4% of US stocks.
  • BRX's strongest trending metric is Quality; it's been moving up over the last 178 days.
  • BRX ranks lowest in Growth; there it ranks in the 34th percentile.

BRX Stock Summary

  • Of note is the ratio of BRIXMOR PROPERTY GROUP INC's sales and general administrative expense to its total operating expenses; merely 11.06% of US stocks have a lower such ratio.
  • The ratio of debt to operating expenses for BRIXMOR PROPERTY GROUP INC is higher than it is for about 92.92% of US stocks.
  • In terms of volatility of its share price, BRX is more volatile than just 12.69% of stocks we're observing.
  • If you're looking for stocks that are quantitatively similar to BRIXMOR PROPERTY GROUP INC, a group of peers worth examining would be DEA, LSI, ADC, REG, and CTRE.
  • BRX's SEC filings can be seen here. And to visit BRIXMOR PROPERTY GROUP INC's official web site, go to www.brixmor.com.

BRX Valuation Summary

  • BRX's price/sales ratio is 5.3; this is 23.26% higher than that of the median Real Estate stock.
  • Over the past 114 months, BRX's price/sales ratio has gone up 1.1.

Below are key valuation metrics over time for BRX.

Stock Date P/S P/B P/E EV/EBIT
BRX 2023-03-10 5.3 2.2 18.1 20.9
BRX 2023-03-09 5.4 2.3 18.7 21.3
BRX 2023-03-08 5.6 2.4 19.1 21.6
BRX 2023-03-07 5.5 2.3 18.9 21.4
BRX 2023-03-06 5.6 2.4 19.4 21.7
BRX 2023-03-03 5.6 2.4 19.4 21.7

BRX Growth Metrics

    Its 2 year cash and equivalents growth rate is now at -93.12%.
  • Its 4 year net income to common stockholders growth rate is now at -5.21%.
  • The year over year net income to common stockholders growth rate now stands at 161.35%.
Over the past 34 months, BRX's revenue has gone up $58,654,000.

The table below shows BRX's growth in key financial areas (numbers in millions of US dollars).

Date Revenue Operating Cash Flow Net Income to Common Stock
2022-12-31 1,218.074 566.382 354.193
2022-09-30 1,204.823 568.519 328.281
2022-06-30 1,190.264 551.493 294.685
2022-03-31 1,171.157 553.986 297.322
2021-12-31 1,152.274 552.239 270.187
2021-09-30 1,126.366 544.349 213.348

BRX's Quality Factors

The “Quality” component of the POWR Ratings focuses on 31 different factors of a companies fundamentals and operational strength. Here are some key insights as we drill into the specifics of these quality attributes.
  • BRX has a Quality Grade of C, ranking ahead of 65.63% of graded US stocks.
  • BRX's asset turnover comes in at 0.135 -- ranking 135th of 443 Trading stocks.
  • AVCT, IVT, and SKT are the stocks whose asset turnover ratios are most correlated with BRX.

The table below shows BRX's key quality metrics over time.

Period Asset Turnover Gross Margin ROIC
2021-09-30 0.135 0.741 0.031
2021-06-30 0.130 0.738 0.030
2021-03-31 0.125 0.732 0.024
2020-12-31 0.124 0.734 0.024
2020-09-30 0.127 0.738 0.026
2020-06-30 0.134 0.741 0.030

BRX Price Target

For more insight on analysts targets of BRX, see our BRX price target page. And for a list of of all stocks sorted by upside potential based on analyst target price, see our Top Price Target page.

Average Price Target $15.00 Average Broker Recommendation 1.89 (Hold)

BRX Stock Price Chart Interactive Chart >

Price chart for BRX

BRX Price/Volume Stats
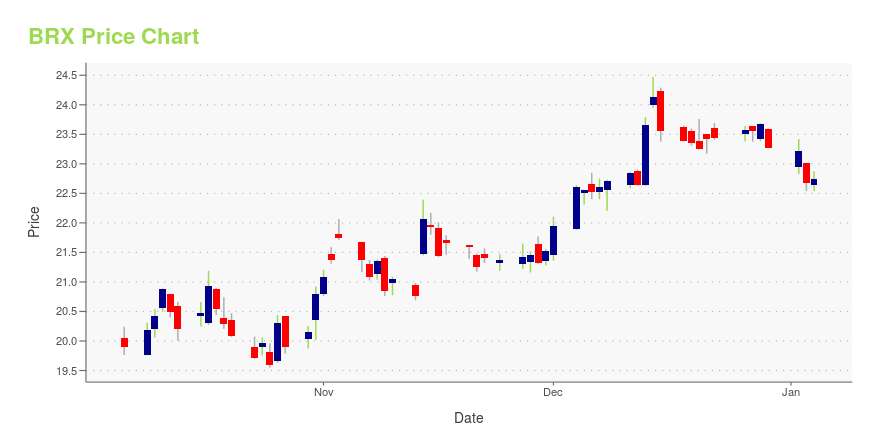
Current price $20.49 52-week high $27.19
Prev. close $20.01 52-week low $17.62
Day low $19.98 Volume 3,803,428
Day high $20.59 Avg. volume 2,688,567
50-day MA $22.54 Dividend yield 5.04%
200-day MA $21.77 Market Cap 6.16B

Brixmor Property Group Inc. (BRX) Company Bio


Brixmor Property Group owns and operates various grocery-anchored community and neighborhood shopping centers in the United States. The company was founded in 2008 and is based in New York, New York.


BRX Latest News Stream


Event/Time News Detail
Loading, please wait...

BRX Latest Social Stream


Loading social stream, please wait...

View Full BRX Social Stream

Latest BRX News From Around the Web

Below are the latest news stories about BRIXMOR PROPERTY GROUP INC that investors may wish to consider to help them evaluate BRX as an investment opportunity.

BRIXMOR PROPERTY GROUP PROMOTES GREG FINLEY TO LEAD WEST REGION

Brixmor Property Group Inc. (NYSE: BRX) ("Brixmor" or the "Company") announced today the promotion of Greg Finley, an experienced real estate professional and respected leader, to Executive Vice President - President, West, effective March 20, 2023. In this role, he will oversee the development and execution of long-term business plans for more than 14 million square feet of open-air retail properties, including leasing, reinvestment, and specialty leasing activities. Mr. Finley will report to B

Yahoo | March 15, 2023

BRIXMOR PROPERTY GROUP TO PRESENT AT CITI's 2023 GLOBAL PROPERTY CEO CONFERENCE

Brixmor Property Group Inc. (NYSE: BRX) today announced that the Company will present at Citi's 2023 Global Property CEO Conference Tuesday, March 7, 2023 from 2:20 PM ET to 2:55 PM ET.

Yahoo | February 22, 2023

Brixmor Property Group Inc. (NYSE:BRX) Q4 2022 Earnings Call Transcript

Brixmor Property Group Inc. (NYSE:BRX) Q4 2022 Earnings Call Transcript February 14, 2023 Operator: Greetings and welcome to Brixmor Property Group Incorporated Fourth Quarter 2022 Earnings Conference Call. At this time, all participants are in a listen-only mode. A brief question-and-answer session will follow the formal presentation. As a reminder, this conference being recorded. It […]

Yahoo | February 16, 2023

Brixmor: Q4 Earnings Snapshot

NEW YORK (AP) — Brixmor Property Group Inc. (BRX) on Monday reported a key measure of profitability in its fourth quarter. The results matched Wall Street expectations. The real estate investment trust, based in New York, said it had funds from operations of $147 million, or 49 cents per share, in the period.

Yahoo | February 13, 2023

BRIXMOR PROPERTY GROUP REPORTS FOURTH QUARTER AND FULL YEAR 2022 RESULTS

Brixmor Property Group Inc. (NYSE: BRX) ("Brixmor" or the "Company") announced today its operating results for the three and twelve months ended December 31, 2022. For the three months ended December 31, 2022 and 2021, net income was $0.35 per diluted share and $0.27 per diluted share, respectively, and for the twelve months ended December 31, 2022 and 2021, net income was $1.17 per diluted share and $0.90 per diluted share, respectively.

Yahoo | February 13, 2023

Read More 'BRX' Stories Here

BRX Price Returns

1-mo -11.76%
3-mo -5.44%
6-mo 3.91%
1-year -14.19%
3-year 131.30%
5-year 78.03%
YTD -8.57%
2022 -6.79%
2021 60.29%
2020 -19.44%
2019 56.89%
2018 -15.93%

BRX Dividends

Ex-Dividend Date Type Payout Amount Change
Loading, please wait...
View Full BRX Dividend History

Get Free Updates

Join thousands of investors who get the latest news, insights and top rated picks from StockNews.com!


Page generated in 0.7452 seconds.