
Black Stone Minerals, L.P (BSM): Price and Financial Metrics
BSM Price/Volume Stats
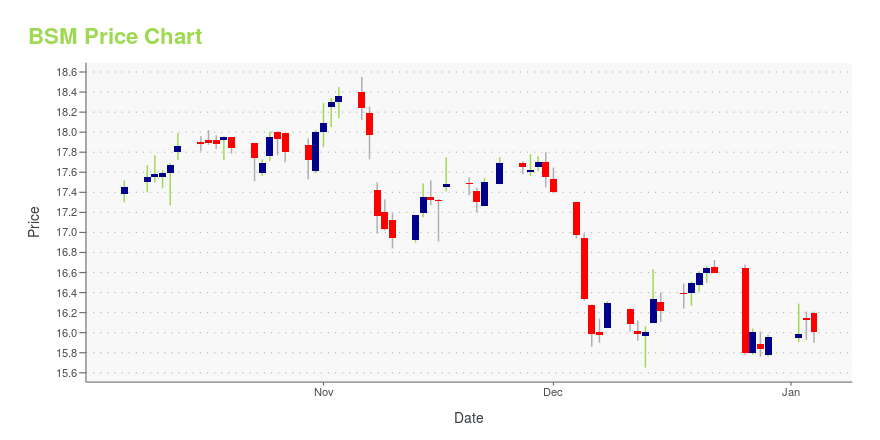
| Current price | $15.38 | 52-week high | $18.55 |
| Prev. close | $15.34 | 52-week low | $14.88 |
| Day low | $15.15 | Volume | 577,227 |
| Day high | $15.42 | Avg. volume | 459,005 |
| 50-day MA | $15.78 | Dividend yield | 9.69% |
| 200-day MA | $16.25 | Market Cap | 3.23B |
BSM Stock Price Chart Interactive Chart >
Black Stone Minerals, L.P (BSM) Company Bio
Black Stone Minerals LP owns oil and natural gas mineral interests in the United States. The company was founded in 1876 and is based in Houston, Texas.
Latest BSM News From Around the Web
Below are the latest news stories about BLACK STONE MINERALS LP that investors may wish to consider to help them evaluate BSM as an investment opportunity.
Black Stone Minerals, L.P. Announces Shelby Trough Operational UpdateHOUSTON, December 22, 2023--Black Stone Minerals, L.P. (NYSE: BSM) ("Black Stone," "BSM," or "the Company") today announced that it had received notice that Aethon Energy ("Aethon") was exercising the "time-out" provisions under its joint exploration agreements with the Company in Angelina and San Augustine counties in East Texas (the "Agreements"). When natural-gas prices fall below specified thresholds, those provisions allow Aethon to temporarily suspend its drilling obligations for up to 9 c |
Implied Volatility Surging for Black Stone Minerals (BSM) Stock OptionsInvestors need to pay close attention to Black Stone Minerals (BSM) stock based on the movements in the options market lately. |
When CEOs Buy Their Own Stock, Pay AttentionAn insider buy is usually a good indication of a value opportunity |
12 Stocks that Could Skyrocket According to Investment NewslettersIn this piece, we will take a look at the 12 stocks with the potential to skyrocket. If you want to skip our overview of the current investment climate, then take a look at 5 Stocks that Could Skyrocket. As the fourth and final quarter of 2023 settles in, it’s clear that markets and the […] |
Black Stone Minerals, L.P. (NYSE:BSM) Q3 2023 Earnings Call TranscriptBlack Stone Minerals, L.P. (NYSE:BSM) Q3 2023 Earnings Call Transcript October 31, 2023 Operator: Good day, everyone and welcome to the Black Stone Minerals 3Q Earnings Conference Call. [Operator Instructions] Please note this call is being recorded. I will be standing by if you should need any assistance. At this time, it is my pleasure […] |
BSM Price Returns
| 1-mo | -1.60% |
| 3-mo | -2.27% |
| 6-mo | -2.17% |
| 1-year | -0.70% |
| 3-year | 96.65% |
| 5-year | 67.06% |
| YTD | 1.63% |
| 2023 | 5.85% |
| 2022 | 80.82% |
| 2021 | 67.42% |
| 2020 | -42.98% |
| 2019 | -9.53% |
BSM Dividends
| Ex-Dividend Date | Type | Payout Amount | Change | ||||||
|---|---|---|---|---|---|---|---|---|---|
| Loading, please wait... | |||||||||
Continue Researching BSM
Want to see what other sources are saying about Black Stone Minerals LP's financials and stock price? Try the links below:Black Stone Minerals LP (BSM) Stock Price | Nasdaq
Black Stone Minerals LP (BSM) Stock Quote, History and News - Yahoo Finance
Black Stone Minerals LP (BSM) Stock Price and Basic Information | MarketWatch
Loading social stream, please wait...