
B2Gold Corp. (BTG): Price and Financial Metrics
BTG Price/Volume Stats
| Current price | $2.91 | 52-week high | $3.60 |
| Prev. close | $2.88 | 52-week low | $2.34 |
| Day low | $2.90 | Volume | 5,515,280 |
| Day high | $2.94 | Avg. volume | 11,382,864 |
| 50-day MA | $2.79 | Dividend yield | 5.39% |
| 200-day MA | $2.86 | Market Cap | 3.80B |
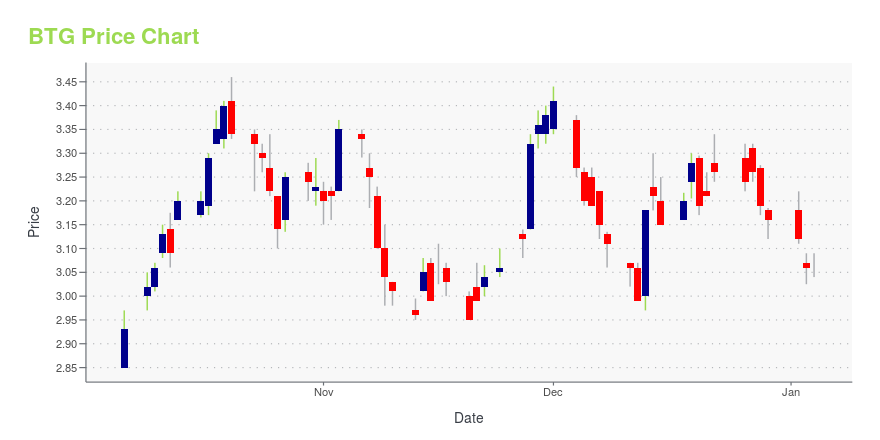
BTG Stock Price Chart Interactive Chart >
B2Gold Corp. (BTG) Company Bio
B2Gold Corporation explores and develops gold & mineral properties in Nicaragua, the Philippines, Namibia, Burkina Faso, and Chile. The company was founded in 2006 and is based in Vancouver, Canada.
Latest BTG News From Around the Web
Below are the latest news stories about B2GOLD CORP that investors may wish to consider to help them evaluate BTG as an investment opportunity.
7 Stocks to Buy if the Fed Goes Through With Interest Rate CutsWhile inflation may have been the theme of 2022, disinflation could be the defining label for the outgoing year, thus warranting a closer examination of stocks to buy for lower interest rates. |
7 New Year’s Stocks to Buy to Get 2024 Off to a Bright StartWith another year in the global markets coming to a close, now is a great time to consider stocks to buy for 2024. |
13 Most Promising Gold Stocks According to AnalystsIn this article, we discuss the 13 most promising gold stocks according to analysts. To skip the detailed analysis of the industry, go directly to the 5 Most Promising Gold Stocks According to Analysts. Gold has started to make noise in the stock and commodity markets again as it recently jumped to a record high. […] |
12 Best Gold Stocks With DividendsIn this article, we will take a detailed look at the 12 Best Gold Stocks With Dividends. For a quick overview of such stocks, read our article 5 Best Gold Stocks With Dividends. As investors look to 2024 for new market dynamics where the Fed is expected to begin cutting interest rates, gold investors are assessing the situation and […] |
13 Cheap Penny Stocks to Buy According to Hedge FundsIn this article, we will take a detailed look at the 13 Cheap Penny Stocks to Buy According to Hedge Funds. To see more such stocks, click 5 Cheap Penny Stocks to Buy According to Hedge Funds. Stocks are roaring as investors celebrate the Fed’s latest announcement saying it’s ready to begin cutting interest rates next year. […] |
BTG Price Returns
| 1-mo | 10.65% |
| 3-mo | 12.76% |
| 6-mo | 8.68% |
| 1-year | -12.45% |
| 3-year | -17.09% |
| 5-year | 3.87% |
| YTD | -5.07% |
| 2023 | -8.31% |
| 2022 | -5.13% |
| 2021 | -27.61% |
| 2020 | 42.26% |
| 2019 | 37.64% |
BTG Dividends
| Ex-Dividend Date | Type | Payout Amount | Change | ||||||
|---|---|---|---|---|---|---|---|---|---|
| Loading, please wait... | |||||||||
Loading social stream, please wait...