First Busey Corporation (BUSE): Price and Financial Metrics

First Busey Corporation (BUSE): $19.65

-0.80 (-3.91%)

POWR Rating

Component Grades

Momentum

C

Stability

C

Sentiment

Quality

D

Add BUSE to Watchlist
Sign Up

Industry: Midwest Regional Banks

Industry

F

Ranked

#20 of 47

in industry

BUSE Price/Volume Stats

Current price $19.65 52-week high $27.98
Prev. close $20.45 52-week low $16.26
Day low $19.59 Volume 198,500
Day high $20.43 Avg. volume 184,236
50-day MA $18.86 Dividend yield 5%
200-day MA $22.83 Market Cap 1.09B

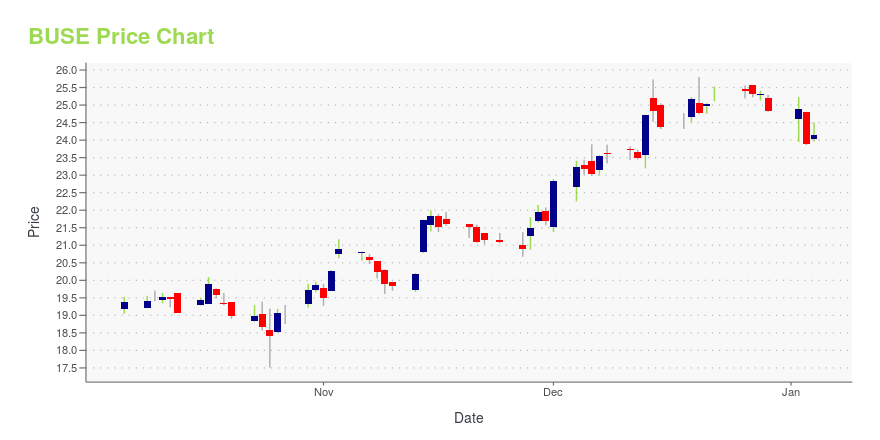
BUSE Stock Price Chart Interactive Chart >

BUSE POWR Grades

  • BUSE scores best on the Stability dimension, with a Stability rank ahead of 74.6% of US stocks.
  • The strongest trend for BUSE is in Stability, which has been heading down over the past 179 days.
  • BUSE's current lowest rank is in the Quality metric (where it is better than 22.72% of US stocks).

BUSE Stock Summary

  • Equity multiplier, or assets relative to shareholders' equity, comes in at 10.74 for FIRST BUSEY CORP; that's greater than it is for 91.36% of US stocks.
  • With a year-over-year growth in debt of 87.21%, FIRST BUSEY CORP's debt growth rate surpasses 87.35% of about US stocks.
  • Shareholder yield, a measure of how much is returned to shareholders via dividends and share repurchases, for BUSE comes in at -45.57% -- higher than that of only 11.42% of stocks in our set.
  • Stocks with similar financial metrics, market capitalization, and price volatility to FIRST BUSEY CORP are BHB, CFBK, WTFC, SYBT, and SSBK.
  • Visit BUSE's SEC page to see the company's official filings. To visit the company's web site, go to www.busey.com.

BUSE Valuation Summary

  • BUSE's price/sales ratio is 2.2; this is 0% higher than that of the median Financial Services stock.
  • Over the past 243 months, BUSE's price/earnings ratio has gone down 10.7.

Below are key valuation metrics over time for BUSE.

Stock Date P/S P/B P/E EV/EBIT
BUSE 2023-05-19 2.2 0.8 7.3 10.9
BUSE 2023-05-18 2.2 0.9 7.5 11.1
BUSE 2023-05-17 2.2 0.9 7.5 11.1
BUSE 2023-05-16 2.1 0.8 7.0 10.7
BUSE 2023-05-15 2.1 0.8 7.1 10.7
BUSE 2023-05-12 2.1 0.8 7.0 10.7

BUSE Growth Metrics

    Its 5 year net income to common stockholders growth rate is now at 70.58%.
  • Its year over year price growth rate is now at -10.88%.
  • Its 4 year net cashflow from operations growth rate is now at -60.08%.
Over the past 34 months, BUSE's revenue has gone up $64,869,000.

The table below shows BUSE's growth in key financial areas (numbers in millions of US dollars).

Date Revenue Operating Cash Flow Net Income to Common Stock
2022-12-31 445.618 165.787 128.311
2022-09-30 436.582 177.534 123.85
2022-06-30 427.591 153.429 114.13
2022-03-31 421.55 158.98 114.072
2021-12-31 418.603 162.012 123.449
2021-09-30 408.564 170.381 121.868

BUSE's Quality Factors

The “Quality” component of the POWR Ratings focuses on 31 different factors of a companies fundamentals and operational strength. Here are some key insights as we drill into the specifics of these quality attributes.
  • BUSE has a Quality Grade of C, ranking ahead of 31.08% of graded US stocks.
  • BUSE's asset turnover comes in at 0.035 -- ranking 280th of 428 Banking stocks.
  • FCNCA, BANR, and BCOR are the stocks whose asset turnover ratios are most correlated with BUSE.

The table below shows BUSE's key quality metrics over time.

Period Asset Turnover Gross Margin ROIC
2021-09-30 0.035 1 0.014
2021-06-30 0.036 1 0.015
2021-03-31 0.036 1 0.016
2020-12-31 0.035 1 0.013
2020-09-30 0.036 1 0.013
2020-06-30 0.037 1 0.013

BUSE Price Target

For more insight on analysts targets of BUSE, see our BUSE price target page. And for a list of of all stocks sorted by upside potential based on analyst target price, see our Top Price Target page.

Average Price Target $27.83 Average Broker Recommendation 1.57 (Moderate Buy)

First Busey Corporation (BUSE) Company Bio


First Busey Corporation offers retail and commercial banking products and services to individual, corporate, institutional, and governmental customers in Illinois, Florida, and Indiana. The company was founded in 1868 and is based in Champaign, Illinois.


BUSE Latest News Stream


Event/Time News Detail
Loading, please wait...

BUSE Latest Social Stream


Loading social stream, please wait...

View Full BUSE Social Stream

Latest BUSE News From Around the Web

Below are the latest news stories about FIRST BUSEY CORP that investors may wish to consider to help them evaluate BUSE as an investment opportunity.

Here's Why First Busey (NASDAQ:BUSE) Has Caught The Eye Of Investors

For beginners, it can seem like a good idea (and an exciting prospect) to buy a company that tells a good story to...

Yahoo | May 12, 2023

Compared to Estimates, First Busey (BUSE) Q1 Earnings: A Look at Key Metrics

While the top- and bottom-line numbers for First Busey (BUSE) give a sense of how the business performed in the quarter ended March 2023, it could be worth looking at how some of its key metrics compare to Wall Street estimates and year-ago values.

Yahoo | April 26, 2023

First Busey (BUSE) Q1 Earnings Meet Estimates

First Busey (BUSE) delivered earnings and revenue surprises of 0% and 2.26%, respectively, for the quarter ended March 2023. Do the numbers hold clues to what lies ahead for the stock?

Yahoo | April 25, 2023

First Busey Announces 2023 First Quarter Earnings

First Busey Reports First Quarter Net Income of $36.8 million and diluted EPS of $0.65CHAMPAIGN, Ill., April 25, 2023 (GLOBE NEWSWIRE) -- First Busey Corporation (Nasdaq: BUSE) Message from our Chairman & CEO First Quarter 2023 Highlights: Diluted earnings per share of $0.65, a 27.5% increase compared with the first quarter of 2022Core loan1 growth of $58.2 million, representing a 3.10% annualized growth rateNon-performing assets of 0.13% of total assets and allowance for credit losses of 602.91

Yahoo | April 25, 2023

Heartland Financial (HTLF) Q1 Earnings and Revenues Miss Estimates

Heartland Financial (HTLF) delivered earnings and revenue surprises of -8.27% and 4.81%, respectively, for the quarter ended March 2023. Do the numbers hold clues to what lies ahead for the stock?

Yahoo | April 24, 2023

Read More 'BUSE' Stories Here

BUSE Price Returns

1-mo 9.23%
3-mo -15.41%
6-mo -18.70%
1-year -13.50%
3-year 9.75%
5-year -27.79%
YTD -18.70%
2022 -5.49%
2021 30.66%
2020 -17.89%
2019 15.79%
2018 -15.89%

BUSE Dividends

Ex-Dividend Date Type Payout Amount Change
Loading, please wait...
View Full BUSE Dividend History

Continue Researching BUSE

Here are a few links from around the web to help you further your research on First Busey Corp's stock as an investment opportunity:

First Busey Corp (BUSE) Stock Price | Nasdaq
First Busey Corp (BUSE) Stock Quote, History and News - Yahoo Finance
First Busey Corp (BUSE) Stock Price and Basic Information | MarketWatch

Get Free Updates

Join thousands of investors who get the latest news, insights and top rated picks from StockNews.com!