
BWX Technologies, Inc. (BWXT): Price and Financial Metrics
BWXT Price/Volume Stats
| Current price | $99.14 | 52-week high | $107.18 |
| Prev. close | $98.73 | 52-week low | $67.91 |
| Day low | $99.01 | Volume | 536,869 |
| Day high | $100.40 | Avg. volume | 582,789 |
| 50-day MA | $93.68 | Dividend yield | 0.91% |
| 200-day MA | $87.90 | Market Cap | 9.06B |
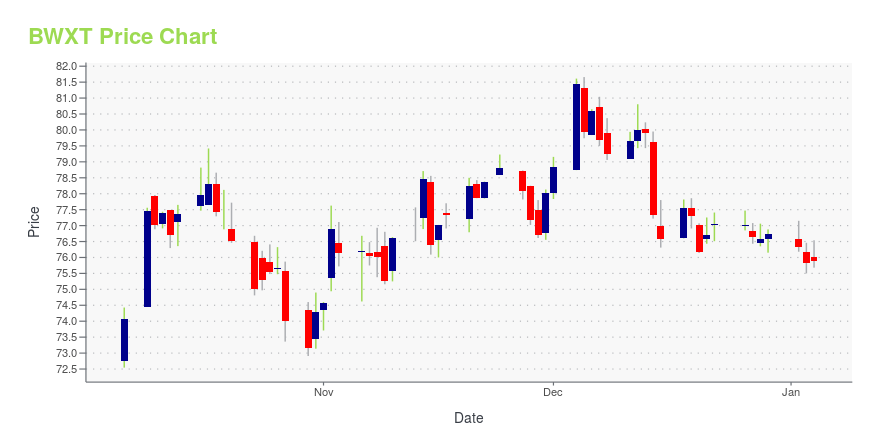
BWXT Stock Price Chart Interactive Chart >
BWX Technologies, Inc. (BWXT) Company Bio
BWX Technologies is a supplier of nuclear components and fuel to the U.S. government; provides technical, management and site services to support governments in the operation of complex facilities and environmental remediation activities; and supplies precision manufactured components and services for the commercial nuclear power industry. The company was formerly known as The Babcock & Wilcox Company and changed its name to BWX Technologies, Inc. in June 2015. BWX Technologies, Inc. was founded in 1867 and is based in Lynchburg, Virginia.
Latest BWXT News From Around the Web
Below are the latest news stories about BWX TECHNOLOGIES INC that investors may wish to consider to help them evaluate BWXT as an investment opportunity.
BWX Technologies: Good Prospects But Not The Right Time To BuyBWX Technologies recently reported better-than-expected third-quarter FY23 financial results. Revenue in the quarter increased by 13% Y/Y to $590 million, with double-digit growth in Government and Commercial operations |
Shareholders Should Be Pleased With BWX Technologies, Inc.'s (NYSE:BWXT) PriceWith a price-to-earnings (or "P/E") ratio of 31.4x BWX Technologies, Inc. ( NYSE:BWXT ) may be sending very bearish... |
BWX Technologies to Host Investor Day on February 28, 2024LYNCHBURG, Va., December 15, 2023--BWX Technologies, Inc. (NYSE: BWXT) today announced that it will host an Investor Day with financial analysts and institutional investors on Wednesday, February 28, 2024. |
7 High-Energy Nuclear Stocks to Power Up Your PortfolioNuclear energy is enjoying a renaissance, and investors can capture global green energy trends with these seven top nuclear stocks. |
Be Wary Of BWX Technologies (NYSE:BWXT) And Its Returns On CapitalTo find a multi-bagger stock, what are the underlying trends we should look for in a business? One common approach is... |
BWXT Price Returns
| 1-mo | 3.82% |
| 3-mo | 3.56% |
| 6-mo | 21.62% |
| 1-year | 46.62% |
| 3-year | 80.31% |
| 5-year | 98.15% |
| YTD | 29.84% |
| 2023 | 33.87% |
| 2022 | 23.30% |
| 2021 | -19.40% |
| 2020 | -1.54% |
| 2019 | 64.48% |
BWXT Dividends
| Ex-Dividend Date | Type | Payout Amount | Change | ||||||
|---|---|---|---|---|---|---|---|---|---|
| Loading, please wait... | |||||||||
Continue Researching BWXT
Want to see what other sources are saying about BWX Technologies Inc's financials and stock price? Try the links below:BWX Technologies Inc (BWXT) Stock Price | Nasdaq
BWX Technologies Inc (BWXT) Stock Quote, History and News - Yahoo Finance
BWX Technologies Inc (BWXT) Stock Price and Basic Information | MarketWatch
Loading social stream, please wait...