
The Blackstone Group Inc. (BX): Price and Financial Metrics
BX Price/Volume Stats
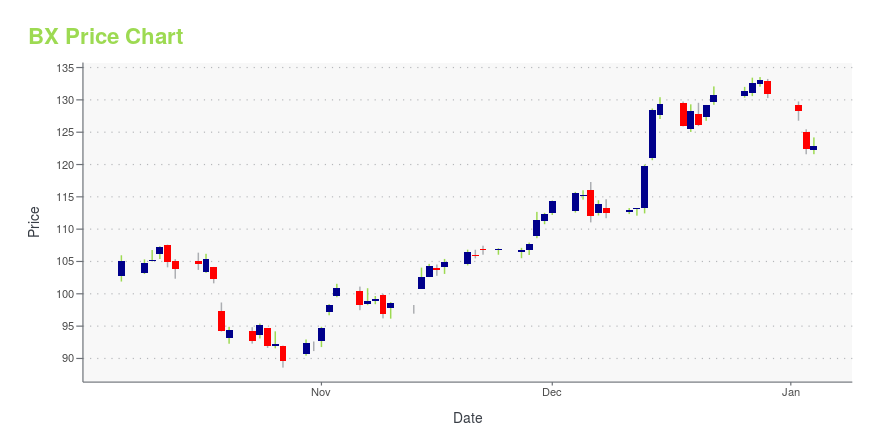
| Current price | $159.80 | 52-week high | $200.96 |
| Prev. close | $163.36 | 52-week low | $115.66 |
| Day low | $159.18 | Volume | 3,985,993 |
| Day high | $163.57 | Avg. volume | 4,306,621 |
| 50-day MA | $144.34 | Dividend yield | 2.3% |
| 200-day MA | $158.01 | Market Cap | 116.60B |
BX Stock Price Chart Interactive Chart >
The Blackstone Group Inc. (BX) Company Bio
Blackstone Group launches and manages private equity funds, real estate funds, funds of hedge funds, and credit-focused funds for its clients. The company was founded in 1985 and is based in New York, New York.
BX Price Returns
| 1-mo | 17.15% |
| 3-mo | 24.38% |
| 6-mo | -8.16% |
| 1-year | 23.96% |
| 3-year | 89.63% |
| 5-year | 243.50% |
| YTD | -5.87% |
| 2024 | 35.07% |
| 2023 | 82.75% |
| 2022 | -39.96% |
| 2021 | 107.11% |
| 2020 | 19.78% |
BX Dividends
| Ex-Dividend Date | Type | Payout Amount | Change | ||||||
|---|---|---|---|---|---|---|---|---|---|
| Loading, please wait... | |||||||||
Continue Researching BX
Here are a few links from around the web to help you further your research on Blackstone Group Inc's stock as an investment opportunity:Blackstone Group Inc (BX) Stock Price | Nasdaq
Blackstone Group Inc (BX) Stock Quote, History and News - Yahoo Finance
Blackstone Group Inc (BX) Stock Price and Basic Information | MarketWatch
Loading social stream, please wait...