Bluelinx Holdings Inc. (BXC): Price and Financial Metrics
BXC Price/Volume Stats
Current price | $88.22 | 52-week high | $93.22 |
Prev. close | $83.61 | 52-week low | $57.49 |
Day low | $84.74 | Volume | 124,100 |
Day high | $89.44 | Avg. volume | 97,067 |
50-day MA | $73.68 | Dividend yield | N/A |
200-day MA | $73.60 | Market Cap | 801.83M |
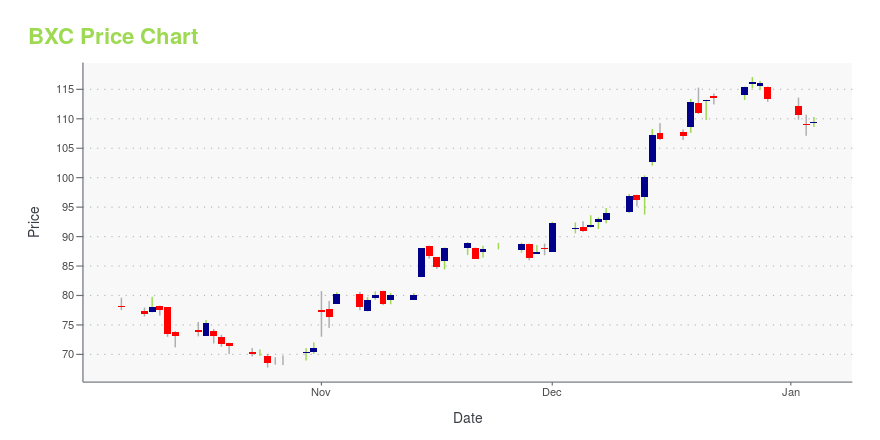
BXC Stock Price Chart Interactive Chart >
BXC POWR Grades
- BXC scores best on the Value dimension, with a Value rank ahead of 99.75% of US stocks.
- BXC's strongest trending metric is Sentiment; it's been moving down over the last 179 days.
- BXC's current lowest rank is in the Growth metric (where it is better than 7.38% of US stocks).
BXC Stock Summary
- BLUELINX HOLDINGS INC's capital turnover -- a measure of revenue relative to shareholder's equity -- is better than 93.48% of US listed stocks.
- Price to trailing twelve month operating cash flow for BXC is currently 1.54, higher than just 6.49% of US stocks with positive operating cash flow.
- BXC's price/sales ratio is 0.19; that's higher than the P/S ratio of just 5.93% of US stocks.
- Stocks that are quantitatively similar to BXC, based on their financial statements, market capitalization, and price volatility, are IBP, MOD, VRM, LAZY, and SCSC.
- BXC's SEC filings can be seen here. And to visit BLUELINX HOLDINGS INC's official web site, go to www.bluelinxco.com.
BXC Valuation Summary
- BXC's price/sales ratio is 0.2; this is 88.24% lower than that of the median Basic Materials stock.
- BXC's price/sales ratio has moved up 0.1 over the prior 224 months.
Below are key valuation metrics over time for BXC.
Stock | Date | P/S | P/B | P/E | EV/EBIT |
---|---|---|---|---|---|
BXC | 2023-05-17 | 0.2 | 1.2 | 4.2 | 3.6 |
BXC | 2023-05-16 | 0.2 | 1.2 | 4.1 | 3.5 |
BXC | 2023-05-15 | 0.2 | 1.2 | 4.0 | 3.5 |
BXC | 2023-05-12 | 0.2 | 1.2 | 3.9 | 3.4 |
BXC | 2023-05-11 | 0.2 | 1.1 | 3.8 | 3.3 |
BXC | 2023-05-10 | 0.2 | 1.1 | 3.8 | 3.3 |
BXC Growth Metrics
- Its year over year cash and equivalents growth rate is now at 41485.47%.
- Its 5 year revenue growth rate is now at 44.97%.
- Its 4 year revenue growth rate is now at 44.97%.

The table below shows BXC's growth in key financial areas (numbers in millions of US dollars).
Date | Revenue | Operating Cash Flow | Net Income to Common Stock |
---|---|---|---|
2022-12-31 | 4,450.214 | 400.297 | 296.176 |
2022-09-30 | 4,575.399 | 264.2 | 337.807 |
2022-06-30 | 4,485.48 | 225.852 | 325.496 |
2022-03-31 | 4,554.014 | 171.868 | 367.682 |
2021-12-31 | 4,277.178 | 145.023 | 296.133 |
2021-09-30 | 4,169.643 | 107.482 | 242.374 |
BXC's Quality Factors
The “Quality” component of the POWR Ratings focuses on 31 different factors of a companies fundamentals and operational strength. Here are some key insights as we drill into the specifics of these quality attributes.- BXC has a Quality Grade of C, ranking ahead of 67.68% of graded US stocks.
- BXC's asset turnover comes in at 3.516 -- ranking 12th of 105 Wholesale stocks.
- HBP, BCC, and POOL are the stocks whose asset turnover ratios are most correlated with BXC.
The table below shows BXC's key quality metrics over time.
Period | Asset Turnover | Gross Margin | ROIC |
---|---|---|---|
2021-10-02 | 3.516 | 0.170 | 0.242 |
2021-07-03 | 3.566 | 0.176 | 0.252 |
2021-04-03 | 3.232 | 0.163 | 0.164 |
2021-01-02 | 2.999 | 0.154 | 0.100 |
2020-09-26 | 2.807 | 0.153 | 0.078 |
2020-06-27 | 2.585 | 0.140 | 0.025 |
BXC Price Target
For more insight on analysts targets of BXC, see our BXC price target page. And for a list of of all stocks sorted by upside potential based on analyst target price, see our Top Price Target page.
Average Price Target | $76.67 | Average Broker Recommendation | 1.67 (Moderate Buy) |
Bluelinx Holdings Inc. (BXC) Company Bio
BlueLinx Holdings Inc. distributes building and industrial products in North America. It distributes products in two principal categories, structural products and specialty products. The companys structural products include plywood, oriented strand board, rebar and remesh, lumber, and other wood products primarily used for structural support, walls, and floorings in construction projects. Its specialty products comprise roofing, insulation, specialty panels, moldings, engineered wood products, vinyl products, outdoor living and metal products, and particle boards. The company was founded in 1996 and is based in Atlanta, Georgia.
Latest BXC News From Around the Web
Below are the latest news stories about BLUELINX HOLDINGS INC that investors may wish to consider to help them evaluate BXC as an investment opportunity.
Q1 2023 Bluelinx Holdings Inc Earnings CallQ1 2023 Bluelinx Holdings Inc Earnings Call |
BlueLinx Holdings (BXC) Lags Q1 Earnings and Revenue EstimatesBlueLinx (BXC) delivered earnings and revenue surprises of -6.64% and 8.39%, respectively, for the quarter ended March 2023. Do the numbers hold clues to what lies ahead for the stock? |
BlueLinx Announces First Quarter 2023 ResultsMARIETTA, Ga., May 02, 2023 (GLOBE NEWSWIRE) -- BlueLinx Holdings Inc. (NYSE: BXC), a leading U.S. wholesale distributor of building products, today reported financial results for the three months ended April 1, 2023. FIRST QUARTER 2023 HIGHLIGHTS(all comparisons are versus the prior year period unless otherwise noted) Net sales of $798 million, a decrease of $504 millionGross profit of $134 million, gross margin of 16.7% and specialty margin of 18.8%Net income of $18 million, or $1.94 diluted e |
BlueLinx Expands Allura Distribution PartnershipMARIETTA, Ga., April 24, 2023 (GLOBE NEWSWIRE) -- BlueLinx Holdings Inc. (NYSE: BXC), a leading U.S. wholesale distributor of building products, and Allura USA, a leading manufacturer of fiber cement siding, announced today the expansion of their distribution partnership. The expansion includes Allura’s branded Spectrum™ Prefinished Siding, Trim, and Accessories as well as Allura’s primed offerings in Panels, Trim, Soffit, Shake and Backerboard. The expanded partnership extends distribution into |
BlueLinx to Host First Quarter 2023 Results Conference Call and Webcast on May 3, 2023MARIETTA, Ga., April 19, 2023 (GLOBE NEWSWIRE) -- BlueLinx Holdings Inc. (NYSE: BXC), a leading U.S. wholesale distributor of building products, will issue first quarter 2023 financial results after the market closes on Tuesday, May 2, 2023. A conference call to discuss the Company’s first quarter results will be hosted by Shyam Reddy, President and Chief Executive Officer, and Kelly Janzen, Senior Vice President and Chief Financial Officer, on Wednesday, May 3, 2023, at 10:00 AM ET. A webcast o |
BXC Price Returns
1-mo | 16.99% |
3-mo | -0.15% |
6-mo | 26.46% |
1-year | 3.68% |
3-year | 1,105.19% |
5-year | 117.40% |
YTD | 24.06% |
2022 | -25.74% |
2021 | 227.27% |
2020 | 105.33% |
2019 | -42.33% |
2018 | 153.18% |
Continue Researching BXC
Want to do more research on BlueLinx Holdings Inc's stock and its price? Try the links below:BlueLinx Holdings Inc (BXC) Stock Price | Nasdaq
BlueLinx Holdings Inc (BXC) Stock Quote, History and News - Yahoo Finance
BlueLinx Holdings Inc (BXC) Stock Price and Basic Information | MarketWatch
Loading social stream, please wait...