Citigroup Inc. (C): Price and Financial Metrics
GET POWR RATINGS... FREE!
C POWR Grades
- Value is the dimension where C ranks best; there it ranks ahead of 88.18% of US stocks.
- C's strongest trending metric is Sentiment; it's been moving down over the last 179 days.
- C's current lowest rank is in the Sentiment metric (where it is better than 4.69% of US stocks).
C Stock Summary
- Citigroup Inc's market capitalization of $111,861,118,796 is ahead of 97.68% of US-listed equities.
- The price/operating cash flow metric for Citigroup Inc is higher than only 5.79% of stocks in our set with a positive cash flow.
- Equity multiplier, or assets relative to shareholders' equity, comes in at 11.51 for Citigroup Inc; that's greater than it is for 94.26% of US stocks.
- If you're looking for stocks that are quantitatively similar to Citigroup Inc, a group of peers worth examining would be ANTM, SONY, TGT, HDB, and USB.
- C's SEC filings can be seen here. And to visit Citigroup Inc's official web site, go to www.citigroup.com.
C Valuation Summary
- C's price/sales ratio is 2; this is 66.67% higher than that of the median Financial Services stock.
- Over the past 243 months, C's price/sales ratio has gone down 0.9.
- C's price/sales ratio has moved down 0.9 over the prior 243 months.
Below are key valuation metrics over time for C.
Stock | Date | P/S | P/B | P/E | EV/EBIT |
---|---|---|---|---|---|
C | 2021-01-29 | 1.6 | 0.6 | 10.0 | 22.1 |
C | 2020-08-05 | 1.4 | 0.6 | 7.7 | 20.5 |
C | 2019-06-17 | 2.1 | 0.8 | 8.5 | 18.1 |
C | 2019-06-03 | 2.0 | 0.7 | 8.0 | 17.7 |
C | 2017-11-15 | 2.7 | 0.8 | 12.1 | 19.2 |
C | 2003-08-27 | 3.0 | 2.4 | 15.0 | 25.1 |
C Growth Metrics
- Its 5 year revenue growth rate is now at 3.06%.
- The 4 year price growth rate now stands at -3.34%.
- Its 3 year price growth rate is now at 51.46%.

The table below shows C's growth in key financial areas (numbers in millions of US dollars).
Date | Revenue | Operating Cash Flow | Net Income to Common Stock |
---|---|---|---|
2021-12-31 | 71,884 | 61,249 | 21,952 |
2021-09-30 | 70,454 | 60,818 | 22,758 |
2021-06-30 | 70,602 | 22,150 | 21,344 |
2021-03-31 | 72,894 | 28,110 | 16,467 |
2020-12-31 | 74,298 | -20,621 | 11,047 |
2020-09-30 | 76,177 | 267 | 12,047 |
C's Quality Factors
The “Quality” component of the POWR Ratings focuses on 31 different factors of a companies fundamentals and operational strength. Here are some key insights as we drill into the specifics of these quality attributes.- C has a Quality Grade of C, ranking ahead of 33.66% of graded US stocks.
- C's asset turnover comes in at 0.031 -- ranking 356th of 428 Banking stocks.
- FBC, ELVT, and GDOT are the stocks whose asset turnover ratios are most correlated with C.
The table below shows C's key quality metrics over time.
Period | Asset Turnover | Gross Margin | ROIC |
---|---|---|---|
2021-06-30 | 0.031 | 1.008 | 0.011 |
2021-03-31 | 0.032 | 0.885 | 0.009 |
2020-12-31 | 0.033 | 0.765 | 0.006 |
2020-09-30 | 0.035 | 0.745 | 0.006 |
2020-06-30 | 0.037 | 0.752 | 0.007 |
2020-03-31 | 0.037 | 0.824 | 0.009 |
C Price Target
For more insight on analysts targets of C, see our C price target page. And for a list of of all stocks sorted by upside potential based on analyst target price, see our Top Price Target page.
Average Price Target | $84.39 | Average Broker Recommendation | 1.54 (Moderate Buy) |
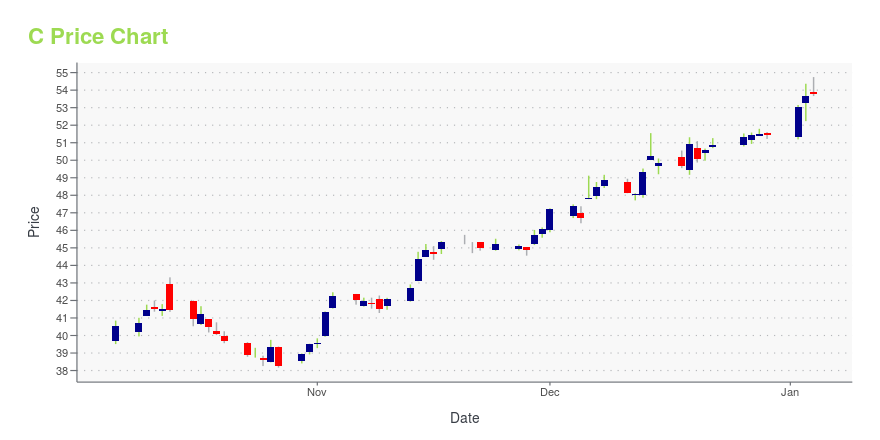
C Stock Price Chart Interactive Chart >
C Price/Volume Stats
Current price | $54.09 | 52-week high | $80.29 |
Prev. close | $52.70 | 52-week low | $45.40 |
Day low | $53.17 | Volume | 19,125,432 |
Day high | $54.25 | Avg. volume | 27,525,295 |
50-day MA | $51.90 | Dividend yield | 3.87% |
200-day MA | $62.71 | Market Cap | 107.15B |
Citigroup Inc. (C) Company Bio
Citigroup Inc. or Citi (stylized as citi) is an American multinational investment bank and financial services corporation headquartered in New York City. The company was formed by the merger of banking giant Citicorp and financial conglomerate Travelers Group in 1998; Travelers was subsequently spun off from the company in 2002. Citigroup owns Citicorp, the holding company for Citibank, as well as several international subsidiaries. Citigroup is incorporated in Delaware. (Source:Wikipedia)
Latest C News From Around the Web
Below are the latest news stories about Citigroup Inc that investors may wish to consider to help them evaluate C as an investment opportunity.
7 Stocks Reporting Earnings the Week Of February 28Earnings season is winding down. |
Citigroup (C) Becomes Largest US Bank to Scrap Overdraft FeesIn a move to make overdraft practices more consumer-friendly, Citigroup (C) will eliminate charging overdraft fees, returned item fees and overdraft protection fees by this summer. |
Citigroup, Bank of America among financial stocks sliding amid Ukraine invasionCitigroup (C -5.1%) and Bank of America (BAC -3.9%) are falling the most of U.S.-based megabanks in midafternoon trading on Thursday in the wake of Russia's invasion of Ukraine. Investors are flocking to government bonds, with the 10-year Treasury yield falling 6 basis points to 1.93% after having touched just... |
Sanctions could complicate Citigroup sale of Russian consumer bank -sourcesThe sale of Citigroup's Russian consumer bank could be complicated by U.S. sanctions on Russian state bank VTB, the only publicly confirmed bidder, banking sources said on Thursday. Although the Russian business is small for Citigroup, it presents an unwelcome headache for the bank's Chief Executive Jane Fraser as she prepares for an investor day next week which could determine the bank's future. Citigroup put the business up for sale last April as part of a broader exit from its international retail operations which it said would take 18 months to complete. |
Analyst eyes better-than-expected ROTCE target for Citi but uncertainty remainsJefferies analyst Ken Usdin expects Citigroup to issue 10% to 12% guidance for its return on average tangible common equity (ROTCE), ahead of the current view. |
C Price Returns
1-mo | 8.79% |
3-mo | -11.83% |
6-mo | -15.91% |
1-year | -27.90% |
3-year | -6.94% |
5-year | 0.90% |
YTD | -8.80% |
2021 | 0.93% |
2020 | -19.70% |
2019 | 57.82% |
2018 | -28.49% |
2017 | 27.03% |
C Dividends
Ex-Dividend Date | Type | Payout Amount | Change | ||||||
---|---|---|---|---|---|---|---|---|---|
Loading, please wait... |
Continue Researching C
Here are a few links from around the web to help you further your research on Citigroup Inc's stock as an investment opportunity:Citigroup Inc (C) Stock Price | Nasdaq
Citigroup Inc (C) Stock Quote, History and News - Yahoo Finance
Citigroup Inc (C) Stock Price and Basic Information | MarketWatch
Loading social stream, please wait...