Meta Financial Group, Inc. (CASH): Price and Financial Metrics
CASH Price/Volume Stats
Current price | $52.15 | 52-week high | $60.49 |
Prev. close | $51.86 | 52-week low | $39.75 |
Day low | $50.95 | Volume | 92,879 |
Day high | $52.29 | Avg. volume | 219,366 |
50-day MA | $47.85 | Dividend yield | 0.39% |
200-day MA | $47.26 | Market Cap | 1.36B |
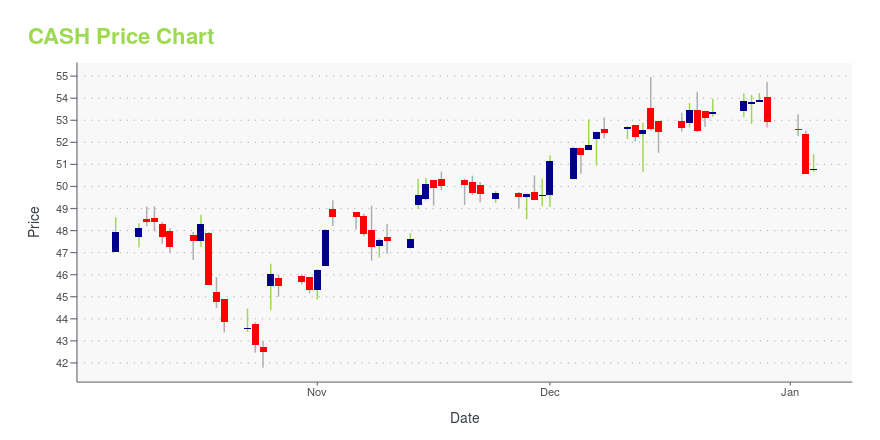
CASH Stock Price Chart Interactive Chart >
CASH POWR Grades
- CASH scores best on the Value dimension, with a Value rank ahead of 74.24% of US stocks.
- The strongest trend for CASH is in Stability, which has been heading up over the past 177 days.
- CASH's current lowest rank is in the Sentiment metric (where it is better than 23.43% of US stocks).
CASH Stock Summary
- With a price/earnings ratio of 8.13, PATHWARD FINANCIAL INC P/E ratio is greater than that of about only 17.48% of stocks in our set with positive earnings.
- For CASH, its debt to operating expenses ratio is greater than that reported by only 14.95% of US equities we're observing.
- CASH's equity multiplier -- a measure of assets relative to shareholders'equity -- is greater than that of 91.28% of US stocks.
- If you're looking for stocks that are quantitatively similar to PATHWARD FINANCIAL INC, a group of peers worth examining would be SMBK, HAFC, HWC, TCBX, and CASS.
- CASH's SEC filings can be seen here. And to visit PATHWARD FINANCIAL INC's official web site, go to www.metafinancialgroup.com.
CASH Valuation Summary
- CASH's price/earnings ratio is 7.9; this is 20.2% lower than that of the median Financial Services stock.
- CASH's EV/EBIT ratio has moved down 60.9 over the prior 243 months.
Below are key valuation metrics over time for CASH.
Stock | Date | P/S | P/B | P/E | EV/EBIT |
---|---|---|---|---|---|
CASH | 2023-11-28 | 2.0 | 2.0 | 7.9 | 5.3 |
CASH | 2023-11-27 | 2.0 | 2.0 | 7.9 | 5.3 |
CASH | 2023-11-24 | 2.0 | 2.0 | 7.9 | 5.4 |
CASH | 2023-11-22 | 2.0 | 2.0 | 7.9 | 5.3 |
CASH | 2023-11-21 | 2.0 | 2.0 | 7.9 | 5.4 |
CASH | 2023-11-20 | 2.1 | 1.9 | 8.7 | 6.3 |
CASH Growth Metrics
- Its 5 year revenue growth rate is now at 98.56%.
- Its 4 year net cashflow from operations growth rate is now at 209.65%.
- Its 5 year net income to common stockholders growth rate is now at 154.55%.

The table below shows CASH's growth in key financial areas (numbers in millions of US dollars).
Date | Revenue | Operating Cash Flow | Net Income to Common Stock |
---|---|---|---|
2022-12-31 | 554.633 | 154.055 | 122.904 |
2022-09-30 | 572.593 | 268.809 | 156.386 |
2022-06-30 | 558.164 | 417.953 | 148.869 |
2022-03-31 | 557.033 | 487.069 | 165.179 |
2021-12-31 | 552.782 | 568.664 | 174.994 |
2021-09-30 | 500.129 | 581.645 | 141.708 |
CASH's Quality Factors
The “Quality” component of the POWR Ratings focuses on 31 different factors of a companies fundamentals and operational strength. Here are some key insights as we drill into the specifics of these quality attributes.- CASH has a Quality Grade of C, ranking ahead of 47.47% of graded US stocks.
- CASH's asset turnover comes in at 0.064 -- ranking 67th of 428 Banking stocks.
- FFIC, BOTJ, and IROQ are the stocks whose asset turnover ratios are most correlated with CASH.
The table below shows CASH's key quality metrics over time.
Period | Asset Turnover | Gross Margin | ROIC |
---|---|---|---|
2021-06-30 | 0.064 | 1 | 0.026 |
2021-03-31 | 0.056 | 1 | 0.022 |
2020-12-31 | 0.063 | 1 | 0.021 |
2020-09-30 | 0.065 | 1 | 0.019 |
2020-06-30 | 0.065 | 1 | 0.019 |
2020-03-31 | 0.074 | 1 | 0.021 |
CASH Price Target
For more insight on analysts targets of CASH, see our CASH price target page. And for a list of of all stocks sorted by upside potential based on analyst target price, see our Top Price Target page.
Average Price Target | $63.00 | Average Broker Recommendation | 1.38 (Strong Buy) |
Meta Financial Group, Inc. (CASH) Company Bio
Meta Financial Group operates as the holding company for MetaBank that offers various banking products and services to commercial, agricultural, and retail customers in Iowa and South Dakota. The company was founded in 1954 and is based in Sioux Falls, South Dakota.
Latest CASH News From Around the Web
Below are the latest news stories about PATHWARD FINANCIAL INC that investors may wish to consider to help them evaluate CASH as an investment opportunity.
Pathward Financial, Inc. Declares Cash DividendSIOUX FALLS, S.D., November 16, 2023--Pathward Financial, Inc. ("Pathward Financial" or the "Company") (Nasdaq: CASH) announced that the Company will pay a cash dividend of $0.05 per share for the first fiscal quarter of 2024. This dividend will be payable on January 2, 2024 to shareholders of record as of December 12, 2023. |
Here's Why Pathward Financial (NASDAQ:CASH) Has Caught The Eye Of InvestorsThe excitement of investing in a company that can reverse its fortunes is a big draw for some speculators, so even... |
Pathward and TabaPay Deepen Partnership to Enable Faster Money Movement Solutions for CustomersSIOUX FALLS, S.D., October 26, 2023--Pathward®, N.A., a U.S.-based financial empowerment company driven by its purpose to power financial inclusion, today announced the expansion of its partnership with TabaPay, a leading money movement platform for merchants and leading fintech brands. The firms first announced partnering in 2020 and the deeper alliance provides added money movement capabilities to Pathward’s partners as they seek to integrate faster payment solutions to meet evolving consumer |
Pathward Financial Inc (CASH) Reports Q4 and Fiscal Year 2023 EarningsA detailed look at the financial performance of Pathward Financial Inc (CASH) for the fourth quarter and fiscal year 2023 |
Pathward Financial, Inc. Announces Results for 2023 Fiscal Fourth Quarter and Fiscal Year 2023SIOUX FALLS, S.D., October 25, 2023--Pathward Financial, Inc. ("Pathward Financial" or the "Company") (Nasdaq: CASH) reported net income of $35.9 million, or $1.36 per share, for the three months ended September 30, 2023, compared to net income of $23.4 million, or $0.81 per share, for the three months ended September 30, 2022. |
CASH Price Returns
1-mo | 8.99% |
3-mo | 6.26% |
6-mo | 4.89% |
1-year | 23.32% |
3-year | 51.74% |
5-year | 162.58% |
YTD | 21.51% |
2022 | -27.48% |
2021 | 63.82% |
2020 | 0.94% |
2019 | 89.68% |
2018 | -36.88% |
CASH Dividends
Ex-Dividend Date | Type | Payout Amount | Change | ||||||
---|---|---|---|---|---|---|---|---|---|
Loading, please wait... |
Continue Researching CASH
Want to do more research on Meta Financial Group Inc's stock and its price? Try the links below:Meta Financial Group Inc (CASH) Stock Price | Nasdaq
Meta Financial Group Inc (CASH) Stock Quote, History and News - Yahoo Finance
Meta Financial Group Inc (CASH) Stock Price and Basic Information | MarketWatch
Loading social stream, please wait...