Colony Bankcorp, Inc. (CBAN): Price and Financial Metrics

Colony Bankcorp, Inc. (CBAN): $9.30

-0.01 (-0.11%)

POWR Rating

Component Grades

Momentum

C

Stability

B

Sentiment

Quality

D

Add CBAN to Watchlist
Sign Up

Industry: Southeast Regional Banks

Industry

F

Ranked

#3 of 28

in industry

CBAN Price/Volume Stats

Current price $9.30 52-week high $17.12
Prev. close $9.31 52-week low $8.59
Day low $9.16 Volume 38,921
Day high $9.39 Avg. volume 41,231
50-day MA $9.58 Dividend yield 4.73%
200-day MA $12.35 Market Cap 163.61M

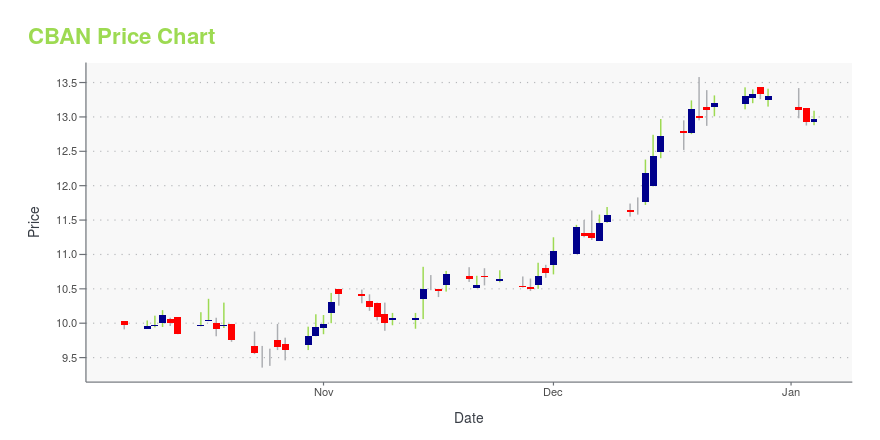
CBAN Stock Price Chart Interactive Chart >

CBAN POWR Grades

  • CBAN scores best on the Sentiment dimension, with a Sentiment rank ahead of 85.77% of US stocks.
  • CBAN's strongest trending metric is Quality; it's been moving down over the last 179 days.
  • CBAN's current lowest rank is in the Quality metric (where it is better than 13.98% of US stocks).

CBAN Stock Summary

  • Equity multiplier, or assets relative to shareholders' equity, comes in at 12.34 for COLONY BANKCORP INC; that's greater than it is for 93.83% of US stocks.
  • With a year-over-year growth in debt of 200.73%, COLONY BANKCORP INC's debt growth rate surpasses 93.09% of about US stocks.
  • COLONY BANKCORP INC's shareholder yield -- a measure of how much capital is returned to stockholders via dividends and buybacks -- is -87.19%, greater than the shareholder yield of only 6.56% of stocks in our set.
  • Stocks that are quantitatively similar to CBAN, based on their financial statements, market capitalization, and price volatility, are FMNB, SAL, FBMS, USCB, and RVSB.
  • CBAN's SEC filings can be seen here. And to visit COLONY BANKCORP INC's official web site, go to www.colonybank.com.

CBAN Valuation Summary

  • In comparison to the median Financial Services stock, CBAN's price/sales ratio is 36.36% lower, now standing at 1.4.
  • Over the past 243 months, CBAN's price/sales ratio has gone down 1.5.

Below are key valuation metrics over time for CBAN.

Stock Date P/S P/B P/E EV/EBIT
CBAN 2023-05-19 1.4 0.7 8.3 13.6
CBAN 2023-05-18 1.5 0.7 8.4 13.7
CBAN 2023-05-17 1.4 0.7 8.4 13.7
CBAN 2023-05-16 1.4 0.7 8.1 13.4
CBAN 2023-05-15 1.4 0.7 8.2 13.5
CBAN 2023-05-12 1.4 0.6 8.0 13.3

CBAN Growth Metrics

    Its year over year revenue growth rate is now at 34.88%.
  • Its 4 year revenue growth rate is now at 37.14%.
  • Its 2 year net income to common stockholders growth rate is now at 112.33%.
Over the past 67 months, CBAN's revenue has gone up $67,075,488.

The table below shows CBAN's growth in key financial areas (numbers in millions of US dollars).

Date Revenue Operating Cash Flow Net Income to Common Stock
2022-09-30 113.926 30.577 18.15
2022-06-30 113.358 12.06 18.481
2022-03-31 108.053 29.783 19.063
2021-12-31 101.779 36.104 18.659
2021-09-30 93.605 51.081 19.398
2021-06-30 86.745 11.803 16.914

CBAN's Quality Factors

The “Quality” component of the POWR Ratings focuses on 31 different factors of a companies fundamentals and operational strength. Here are some key insights as we drill into the specifics of these quality attributes.
  • CBAN has a Quality Grade of C, ranking ahead of 32.18% of graded US stocks.
  • CBAN's asset turnover comes in at 0.049 -- ranking 97th of 431 Banking stocks.
  • HWBK, ALLY, and ESSA are the stocks whose asset turnover ratios are most correlated with CBAN.

The table below shows CBAN's key quality metrics over time.

Period Asset Turnover Gross Margin ROIC
2021-06-30 0.049 1 0.013
2021-03-31 0.045 1 0.011
2020-12-31 0.043 1 0.009
2020-09-30 0.042 1 0.007
2020-06-30 0.041 1 0.007
2020-03-31 0.043 1 0.007

CBAN Price Target

For more insight on analysts targets of CBAN, see our CBAN price target page. And for a list of of all stocks sorted by upside potential based on analyst target price, see our Top Price Target page.

Average Price Target $23.25 Average Broker Recommendation 1.25 (Strong Buy)

Colony Bankcorp, Inc. (CBAN) Company Bio


Colony Bankcorp, Inc. operates as the bank holding company for Colony Bank that provides banking products and services to retail and commercial customers in Georgia. The company was founded in 1975 and is based in Fitzgerald, Georgia.


CBAN Latest News Stream


Event/Time News Detail
Loading, please wait...

CBAN Latest Social Stream


Loading social stream, please wait...

View Full CBAN Social Stream

Latest CBAN News From Around the Web

Below are the latest news stories about COLONY BANKCORP INC that investors may wish to consider to help them evaluate CBAN as an investment opportunity.

Colony Bankcorp Announces That KBRA Affirms the Company’s Ratings

FITZGERALD, Ga., May 15, 2023--Colony Bankcorp, Inc. (Nasdaq: CBAN) ("Colony" or the "Company") announced today the Company's ratings were affirmed by the Kroll Bond Rating Agency (KBRA) in its press release dated May 12, 2023. KBRA affirmed the senior unsecured debt rating of BBB, the subordinated debt rating of BBB-, and the short-term debt rating of K3 for the Company. KBRA indicated a Stable outlook for all long-term ratings and among its key credit considerations, cited favorable views of t

Yahoo | May 15, 2023

Is It Smart To Buy Colony Bankcorp, Inc. (NASDAQ:CBAN) Before It Goes Ex-Dividend?

It looks like Colony Bankcorp, Inc. ( NASDAQ:CBAN ) is about to go ex-dividend in the next 4 days. The ex-dividend date...

Yahoo | May 4, 2023

Colony Bankcorp (NASDAQ:CBAN) Is Paying Out A Dividend Of $0.11

The board of Colony Bankcorp, Inc. ( NASDAQ:CBAN ) has announced that it will pay a dividend of $0.11 per share on the...

Yahoo | May 2, 2023

Colony Bankcorp (CBAN) Tops Q1 Earnings Estimates

Colony Bankcorp (CBAN) delivered earnings and revenue surprises of 14.81% and 2.40%, respectively, for the quarter ended March 2023. Do the numbers hold clues to what lies ahead for the stock?

Yahoo | April 27, 2023

Colony Bankcorp Reports First Quarter 2023 Results Declares Quarterly Cash Dividend of $0.11 Per Share

FITZGERALD, Ga., April 27, 2023--Colony Bankcorp, Inc. (Nasdaq: CBAN) ("Colony" or the "Company") today reported financial results for the first quarter of 2023. Financial highlights are shown below.

Yahoo | April 27, 2023

Read More 'CBAN' Stories Here

CBAN Price Returns

1-mo -4.69%
3-mo -24.37%
6-mo -30.54%
1-year N/A
3-year -19.90%
5-year -33.99%
YTD -25.18%
2022 -23.53%
2021 19.46%
2020 -8.29%
2019 15.12%
2018 1.23%

CBAN Dividends

Ex-Dividend Date Type Payout Amount Change
Loading, please wait...
View Full CBAN Dividend History

Continue Researching CBAN

Want to see what other sources are saying about Colony Bankcorp Inc's financials and stock price? Try the links below:

Colony Bankcorp Inc (CBAN) Stock Price | Nasdaq
Colony Bankcorp Inc (CBAN) Stock Quote, History and News - Yahoo Finance
Colony Bankcorp Inc (CBAN) Stock Price and Basic Information | MarketWatch

Get Free Updates

Join thousands of investors who get the latest news, insights and top rated picks from StockNews.com!