
Crown Holdings Inc. (CCK): Price and Financial Metrics
CCK Price/Volume Stats
| Current price | $85.68 | 52-week high | $95.31 |
| Prev. close | $84.90 | 52-week low | $69.61 |
| Day low | $85.03 | Volume | 1,556,504 |
| Day high | $86.86 | Avg. volume | 1,154,270 |
| 50-day MA | $79.61 | Dividend yield | 1.19% |
| 200-day MA | $81.83 | Market Cap | 10.35B |
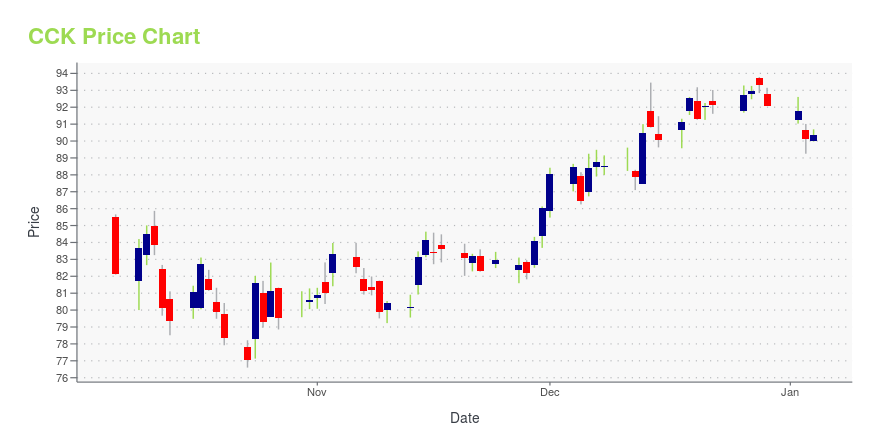
CCK Stock Price Chart Interactive Chart >
Crown Holdings Inc. (CCK) Company Bio
Crown Holdings, Inc., formerly Crown Cork & Seal Company, is an American company that makes metal beverage and food cans, metal aerosol containers, metal closures and specialty packing. Founded in 1892, it is headquartered in Yardley, Pennsylvania. As of their annual report for 2020, Crown employs 33,264 people at 192 plants in 39 countries. It claims to manufacture one out of every five beverage cans used in the world, and one out of every three food cans used in North America and Europe. The company is ranked No. 269 in the Fortune 500 list for 2021 and is number one in the packaging and container industry for the same list. (Source:Wikipedia)
Latest CCK News From Around the Web
Below are the latest news stories about CROWN HOLDINGS INC that investors may wish to consider to help them evaluate CCK as an investment opportunity.
'Can Do' Attitude Needed To Achieve 100 Percent Recycling Rate for All Aluminium Drinks CansDUBAI, UAE / ACCESSWIRE / December 27, 2023 / A 100 percent recycling target by 2050 for the world's aluminium drinks cans has been set by industry leaders at COP 28. Aluminium producers, recyclers, rolling mills, can makers and industry associations ... |
Crown Holdings (NYSE:CCK) Hasn't Managed To Accelerate Its ReturnsDid you know there are some financial metrics that can provide clues of a potential multi-bagger? Ideally, a business... |
Crown Holdings Supports Efforts to Raise Aluminum Beverage Can RecyclingNORTHAMPTON, MA / ACCESSWIRE / December 19, 2023 / Ardagh Group and Crown Holdings, Inc. are continuing their efforts to raise aluminum beverage can recycling rates through Can Manufacturers Institute (CMI) by financing a robot from artificial intelligence ... |
Blackstone-owned Crown faces probe by Victoria's casino regulator(Reuters) -Blackstone-owned Crown Resorts is facing a investigation by an Australian state regulator after the casino operator said it was probing into CEO Ciaran Carruthers, who allegedly overruled the casino's security officers over banning intoxicated customers. "In relation to the CEO's conduct, the Victorian Gambling and Casino Control Commission (VGCCC) will review the outcome of Crown's investigation into its CEO before determining what, if any, regulatory action may be taken," the sector regulator for the state of Victoria said in a statement on Wednesday. "The VGCCC had already been aware of a minor being allowed onto the gaming floor and we are actively investigating," VGCCC added. |
Crown Holdings 2022 Sustainability Report: Our Approach to SustainabilityNORTHAMPTON, MA / ACCESSWIRE / December 12, 2023 / Crown Holdings, Inc.Originally published in Crown Holding's 2022 Corporate Responsibility ReportBuilt around 20 aggressive - but measurable - sustainability goals to be completed by or before the ... |
CCK Price Returns
| 1-mo | 10.65% |
| 3-mo | 6.65% |
| 6-mo | -5.29% |
| 1-year | -7.34% |
| 3-year | -11.23% |
| 5-year | 37.52% |
| YTD | -6.37% |
| 2023 | 13.29% |
| 2022 | -24.99% |
| 2021 | 11.26% |
| 2020 | 38.13% |
| 2019 | 74.50% |
CCK Dividends
| Ex-Dividend Date | Type | Payout Amount | Change | ||||||
|---|---|---|---|---|---|---|---|---|---|
| Loading, please wait... | |||||||||
Continue Researching CCK
Want to do more research on Crown Holdings Inc's stock and its price? Try the links below:Crown Holdings Inc (CCK) Stock Price | Nasdaq
Crown Holdings Inc (CCK) Stock Quote, History and News - Yahoo Finance
Crown Holdings Inc (CCK) Stock Price and Basic Information | MarketWatch
Loading social stream, please wait...