
Camber Energy, Inc. (CEI): Price and Financial Metrics
CEI Price/Volume Stats
| Current price | $0.13 | 52-week high | $1.07 |
| Prev. close | $0.13 | 52-week low | $0.10 |
| Day low | $0.13 | Volume | 6,501,984 |
| Day high | $0.13 | Avg. volume | 6,303,274 |
| 50-day MA | $0.14 | Dividend yield | N/A |
| 200-day MA | $0.21 | Market Cap | 22.71M |
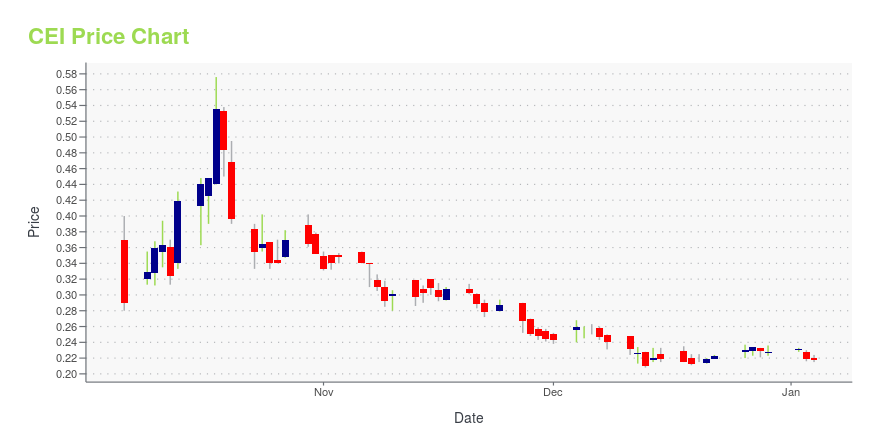
CEI Stock Price Chart Interactive Chart >
Camber Energy, Inc. (CEI) Company Bio
Camber Energy, Inc., an independent oil and natural gas company, engages in the acquisition, development, and sale of crude oil, natural gas, and natural gas liquids (NGL) in the Cline shale and upper Wolfberry shale in Glasscock County, Texas. As of March 31, 2020, its total estimated proved reserves were 133,442 million barrels of oil equivalent comprising 54,850 barrels of crude oil reserves, 43,955 barrels of NGL reserves, and 207,823 million cubic feet of natural gas reserves. The company was formerly known as Lucas Energy Inc. and changed its name to Camber Energy, Inc. in January 2017. Camber Energy, Inc. was incorporated in 2003 and is based in Houston, Texas.
Latest CEI News From Around the Web
Below are the latest news stories about CAMBER ENERGY INC that investors may wish to consider to help them evaluate CEI as an investment opportunity.
Camber Energy Reports Significantly Higher Revenues Post VKIN MergerStockholders' Equity also Significantly Greater as a Result of MergerHOUSTON, TX / ACCESSWIRE / November 14, 2023 / Camber Energy, Inc. (NYSE American:CEI) ("Camber" or the "Company"), a growth-oriented diversified energy company, today filed its ... |
Camber Energy Announces Notices of Allowance for Additional PatentsCEI Continues to Enhance & Strengthen IP PortfolioHOUSTON, TX / ACCESSWIRE / November 7, 2023 / Camber Energy, Inc. (NYSE American:CEI) ("Camber" or the "Company") is pleased to announce that Viking Protection Systems, LLC ("Viking Protection") received ... |
Camber Energy Successfully Secures Dismissal of Class Action LawsuitHOUSTON, TX / ACCESSWIRE / November 2, 2023 / Camber Energy, Inc. (NYSE American:CEI) ("Camber" or the "Company") is pleased to announce the dismissal of the previously disclosed Class Action Complaint (i.e. C.A.No.4:21-cv-03574) filed against the ... |
Camber Energy Announces Agreement with U.K. Distributor for VKIN-Ozone Proprietary Waste Treatment SystemHOUSTON, TX / ACCESSWIRE / October 3, 2023 / Camber Energy, Inc. (NYSE American:CEI) ("Camber" or the "Company") is pleased to announce that Simson-Maxwell Ltd. ("Simson-Maxwell"), a majority-owned subsidiary of Viking Energy Group, Inc., a company ... |
Camber Energy Announces Issuance of New Patent Covering Transmission Line Ground Fault Prevention SystemsI.P. is Part of Solution Designed to Reduce Wildfires and Improve Grid StabilityHOUSTON, TX / ACCESSWIRE / September 27, 2023 / Camber Energy, Inc. (NYSE American:CEI) ("Camber" or the "Company"), today announced that on September 26, 2023 the U.S. ... |
CEI Price Returns
| 1-mo | 10.83% |
| 3-mo | -24.51% |
| 6-mo | -24.86% |
| 1-year | -83.77% |
| 3-year | -99.41% |
| 5-year | -100.00% |
| YTD | -43.08% |
| 2023 | -88.69% |
| 2022 | -95.25% |
| 2021 | -7.94% |
| 2020 | -51.66% |
| 2019 | -99.87% |
Continue Researching CEI
Here are a few links from around the web to help you further your research on Camber Energy Inc's stock as an investment opportunity:Camber Energy Inc (CEI) Stock Price | Nasdaq
Camber Energy Inc (CEI) Stock Quote, History and News - Yahoo Finance
Camber Energy Inc (CEI) Stock Price and Basic Information | MarketWatch
Loading social stream, please wait...