
Crestwood Equity Partners LP (CEQP): Price and Financial Metrics
CEQP Price/Volume Stats
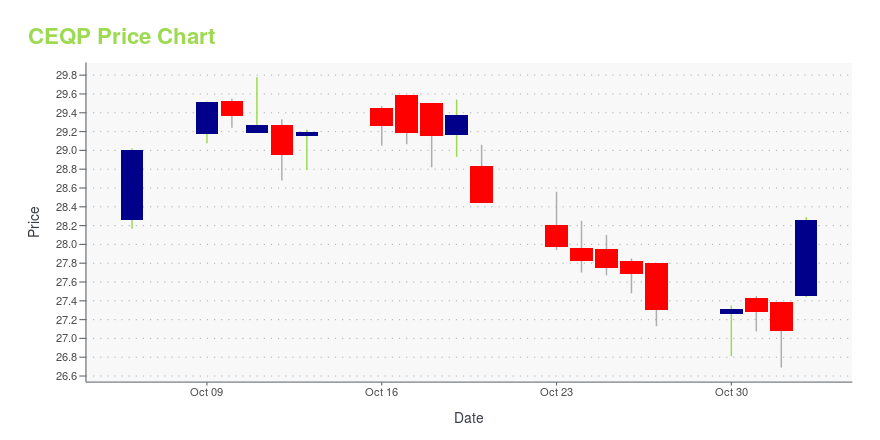
| Current price | $28.26 | 52-week high | $30.40 |
| Prev. close | $27.08 | 52-week low | $22.11 |
| Day low | $27.44 | Volume | 4,390,700 |
| Day high | $28.29 | Avg. volume | 573,742 |
| 50-day MA | $28.60 | Dividend yield | 9.27% |
| 200-day MA | $26.61 | Market Cap | 2.97B |
CEQP Stock Price Chart Interactive Chart >
Crestwood Equity Partners LP (CEQP) Company Bio
Crestwood Equity Partners LP provides midstream solutions to customers in the crude oil, natural gas liquids (NGLs), and natural gas sectors of the energy industry in the United States. It operates through three segments: Gathering and Processing; Storage and Transportation; and NGL and Crude Services. The company was formerly known as Inergy L.P. and changed its name to Crestwood Equity Partners LP in October 2013. The company is based in Houston, Texas.
Latest CEQP News From Around the Web
Below are the latest news stories about CRESTWOOD EQUITY PARTNERS LP that investors may wish to consider to help them evaluate CEQP as an investment opportunity.
Crestwood Unitholders Approve Energy Transfer TransactionHOUSTON, October 30, 2023--Crestwood Equity Partners LP (NYSE: CEQP) ("Crestwood") today announced that, at its special meeting of unitholders (the "Special Meeting"), Crestwood unitholders approved the previously announced transaction (the "Transaction") with Energy Transfer LP ("Energy Transfer"). The Transaction is expected to close on November 3, 2023. |
Crestwood Announces Receipt of Requisite Consents With Respect to its Previously Announced Consent SolicitationHOUSTON, October 24, 2023--Crestwood Equity Partners LP (NYSE: CEQP) ("Crestwood") today announced the receipt of consents from holders of record of its outstanding 9.250% Perpetual Preferred Units (the "Preferred Units") (CUSIP/ISIN: 226344307 / US2263443077) as of September 22, 2023 (collectively, the "Preferred Holders") necessary to approve the proposed amendment (the "Proposed Amendment") to Crestwood’s Sixth Amended and Restated Agreement of Limited Partnership, dated August 20, 2021, in c |
Energy Transfer, Crestwood Set Election Date for Unitholders to Vote on Form of MergerThe election is amid Energy Transfer’s pending acquisition of Crestwood Equity Partners for $7.1 billion in an all-stock transaction on Aug. 18. |
Leading Independent Proxy Advisory Firm Glass Lewis Recommends Crestwood Unitholders Vote "FOR" the Transaction with Energy TransferHOUSTON, October 23, 2023--Crestwood Equity Partners LP (NYSE: CEQP) ("Crestwood") today announced that leading independent proxy advisory firm Glass Lewis & Co. ("Glass Lewis") recommends that unitholders vote "FOR" the pending transaction (the "Transaction") with Energy Transfer LP (NYSE: ET) ("Energy Transfer") ahead of the special meeting of unitholders scheduled to be held on October 30, 2023. |
Energy Transfer and Crestwood Announce Election Deadline for Crestwood Preferred Unitholders to Elect Form of Merger ConsiderationDALLAS & HOUSTON, October 23, 2023--Energy Transfer LP (NYSE: ET) ("Energy Transfer") and Crestwood Equity Partners LP (NYSE: CEQP) ("Crestwood") announced today that, in connection with Energy Transfer’s pending acquisition of Crestwood, the deadline for holders of Crestwood’s outstanding 9.250% Perpetual Preferred Units (the "Crestwood Preferred Units" and such holders, the "Crestwood Preferred Unitholders") to elect the form of merger consideration they wish to receive in the transaction has |
CEQP Price Returns
| 1-mo | N/A |
| 3-mo | N/A |
| 6-mo | N/A |
| 1-year | 3.59% |
| 3-year | 26.77% |
| 5-year | 27.92% |
| YTD | N/A |
| 2023 | 0.00% |
| 2022 | 3.89% |
| 2021 | 59.69% |
| 2020 | -27.94% |
| 2019 | 18.44% |
CEQP Dividends
| Ex-Dividend Date | Type | Payout Amount | Change | ||||||
|---|---|---|---|---|---|---|---|---|---|
| Loading, please wait... | |||||||||
Continue Researching CEQP
Want to do more research on Crestwood Equity Partners LP's stock and its price? Try the links below:Crestwood Equity Partners LP (CEQP) Stock Price | Nasdaq
Crestwood Equity Partners LP (CEQP) Stock Quote, History and News - Yahoo Finance
Crestwood Equity Partners LP (CEQP) Stock Price and Basic Information | MarketWatch
Loading social stream, please wait...