C&F Financial Corporation (CFFI): Price and Financial Metrics
CFFI Price/Volume Stats
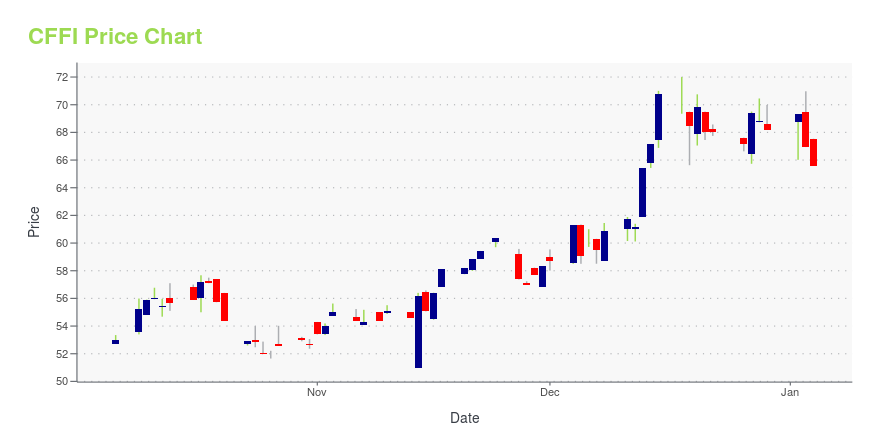
| Current price | $57.98 | 52-week high | $72.00 |
| Prev. close | $56.31 | 52-week low | $33.51 |
| Day low | $56.60 | Volume | 8,700 |
| Day high | $58.15 | Avg. volume | 15,212 |
| 50-day MA | $46.77 | Dividend yield | 3.35% |
| 200-day MA | $51.91 | Market Cap | 194.70M |
CFFI Stock Price Chart Interactive Chart >
C&F Financial Corporation (CFFI) Company Bio
C&F Financial Corporation operates as a bank holding company for Citizens and Farmers Bank that provides commercial banking services to individuals and businesses in Virginia, Maryland and North Carolina.
Latest CFFI News From Around the Web
Below are the latest news stories about C & F FINANCIAL CORP that investors may wish to consider to help them evaluate CFFI as an investment opportunity.
C&F Financial Corporation Reauthorizes Share Repurchase ProgramTOANO, Va., Dec. 20, 2023 (GLOBE NEWSWIRE) -- The board of directors of C&F Financial Corporation (NASDAQ:CFFI) (the Corporation) has authorized a program, effective January 1, 2024, to repurchase up to $10 million of the Corporation’s common stock through December 31, 2024. Repurchases under the program may be made through privately negotiated transactions or open market transactions, including pursuant to a trading plan in accordance with Rule 10b5-1 and/or Rule 10b-18 under the Securities Exc |
There's A Lot To Like About C&F Financial's (NASDAQ:CFFI) Upcoming US$0.44 DividendRegular readers will know that we love our dividends at Simply Wall St, which is why it's exciting to see C&F Financial... |
C&F Financial Corporation Announces Quarterly DividendTOANO, Va., Nov. 22, 2023 (GLOBE NEWSWIRE) -- The board of directors of C&F Financial Corporation (NASDAQ:CFFI) (the Corporation) has declared a regular cash dividend of 44 cents per share, which is payable January 1, 2024 to shareholders of record on December 15, 2023. The Board of Directors of the Corporation continually reviews the amount of cash dividends per share and the resulting dividend payout ratio in light of changes in economic conditions, current and future capital requirements, and |
C&F Financial Corp (CFFI) Announces Q3 and Nine-Month EarningsThird quarter and nine-month earnings for 2023 show a decrease compared to 2022 |
C&F Financial Corporation Announces Net Income for Third Quarter and First Nine MonthsTOANO, Va., Oct. 26, 2023 (GLOBE NEWSWIRE) -- C&F Financial Corporation (the Corporation) (NASDAQ: CFFI), the one-bank holding company for C&F Bank, today reported consolidated net income of $5.8 million for the third quarter of 2023, which represents a decrease of $768,000, or 11.7 percent, as compared to the third quarter of 2022. The Corporation reported consolidated net income of $18.7 million for the first nine months of 2023, which represents a decrease of $405,000, or 2.1 percent, as comp |
CFFI Price Returns
| 1-mo | 11.61% |
| 3-mo | 51.89% |
| 6-mo | 1.86% |
| 1-year | 3.34% |
| 3-year | 20.99% |
| 5-year | 26.39% |
| YTD | -13.41% |
| 2023 | 20.69% |
| 2022 | 17.47% |
| 2021 | 42.26% |
| 2020 | -29.88% |
| 2019 | 7.02% |
CFFI Dividends
| Ex-Dividend Date | Type | Payout Amount | Change | ||||||
|---|---|---|---|---|---|---|---|---|---|
| Loading, please wait... | |||||||||
Continue Researching CFFI
Want to do more research on C & F Financial Corp's stock and its price? Try the links below:C & F Financial Corp (CFFI) Stock Price | Nasdaq
C & F Financial Corp (CFFI) Stock Quote, History and News - Yahoo Finance
C & F Financial Corp (CFFI) Stock Price and Basic Information | MarketWatch


Loading social stream, please wait...