Citizens Financial Group Inc. (CFG): Price and Financial Metrics
GET POWR RATINGS... FREE!
CFG POWR Grades
- CFG scores best on the Momentum dimension, with a Momentum rank ahead of 89.62% of US stocks.
- The strongest trend for CFG is in Growth, which has been heading down over the past 179 days.
- CFG's current lowest rank is in the Sentiment metric (where it is better than 13.43% of US stocks).
CFG Stock Summary
- CFG has a higher market value than 87.88% of US stocks; more precisely, its current market capitalization is $20,532,966,646.
- Equity multiplier, or assets relative to shareholders' equity, comes in at 8.07 for Citizens Financial Group Inc; that's greater than it is for 87.31% of US stocks.
- Shareholder yield, a measure of how much is returned to shareholders via dividends and share repurchases, for CFG comes in at 12.04% -- higher than that of 86.37% of stocks in our set.
- Stocks that are quantitatively similar to CFG, based on their financial statements, market capitalization, and price volatility, are JBHT, WRB, FHN, KEY, and ZION.
- CFG's SEC filings can be seen here. And to visit Citizens Financial Group Inc's official web site, go to www.citizensbank.com.
CFG Valuation Summary
- CFG's price/sales ratio is 2.7; this is 15.62% lower than that of the median Financial Services stock.
- CFG's price/sales ratio has moved down 0.2 over the prior 84 months.
- CFG's price/earnings ratio has moved down 7.3 over the prior 84 months.
Below are key valuation metrics over time for CFG.
Stock | Date | P/S | P/B | P/E | EV/EBIT |
---|---|---|---|---|---|
CFG | 2018-12-21 | 2.3 | 0.7 | 7.0 | 12.9 |
CFG | 2017-07-18 | 3.6 | 0.9 | 16.0 | 18.1 |
CFG | 2016-08-12 | 2.6 | 0.6 | 13.5 | 17.1 |
CFG | 2016-06-27 | 2.1 | 0.5 | 11.6 | 16.9 |
CFG | 2016-04-18 | 2.7 | 0.6 | 14.4 | 17.4 |
CFG | 2016-02-04 | 2.4 | 0.5 | 13.2 | 16.4 |
CFG Growth Metrics
- Its 2 year net income to common stockholders growth rate is now at -23.45%.
- Its year over year net cashflow from operations growth rate is now at 833.33%.
- The 2 year price growth rate now stands at -49.61%.

The table below shows CFG's growth in key financial areas (numbers in millions of US dollars).
Date | Revenue | Operating Cash Flow | Net Income to Common Stock |
---|---|---|---|
2021-12-31 | 7,058 | 2,275 | 2,206 |
2021-09-30 | 6,896 | 2,036 | 2,132 |
2021-06-30 | 6,567 | 1,414 | 1,917 |
2021-03-31 | 6,031 | 748 | 1,526 |
2020-12-31 | 5,289 | 111 | 950 |
2020-09-30 | 5,233 | -28 | 953 |
CFG's Quality Factors
The “Quality” component of the POWR Ratings focuses on 31 different factors of a companies fundamentals and operational strength. Here are some key insights as we drill into the specifics of these quality attributes.- CFG has a Quality Grade of C, ranking ahead of 35.46% of graded US stocks.
- CFG's asset turnover comes in at 0.037 -- ranking 238th of 428 Banking stocks.
- HWC, STL, and ZION are the stocks whose asset turnover ratios are most correlated with CFG.
The table below shows CFG's key quality metrics over time.
Period | Asset Turnover | Gross Margin | ROIC |
---|---|---|---|
2021-09-30 | 0.037 | 1 | 0.016 |
2021-06-30 | 0.036 | 1 | 0.014 |
2021-03-31 | 0.033 | 1 | 0.011 |
2020-12-31 | 0.029 | 1 | 0.007 |
2020-09-30 | 0.030 | 1 | 0.007 |
2020-06-30 | 0.031 | 1 | 0.008 |
CFG Price Target
For more insight on analysts targets of CFG, see our CFG price target page. And for a list of of all stocks sorted by upside potential based on analyst target price, see our Top Price Target page.
Average Price Target | $51.75 | Average Broker Recommendation | 1.5 (Moderate Buy) |
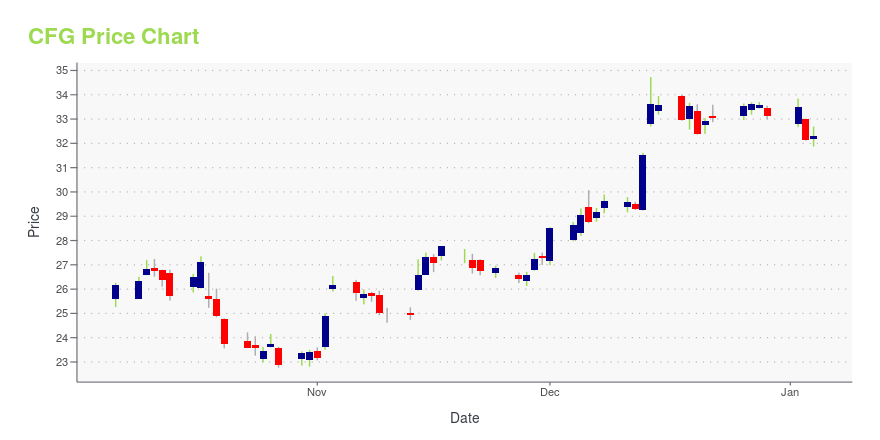
CFG Stock Price Chart Interactive Chart >
CFG Price/Volume Stats
Current price | $38.00 | 52-week high | $57.00 |
Prev. close | $39.41 | 52-week low | $36.83 |
Day low | $37.59 | Volume | 6,143,100 |
Day high | $39.00 | Avg. volume | 6,311,757 |
50-day MA | $43.35 | Dividend yield | 3.96% |
200-day MA | $47.08 | Market Cap | 18.83B |
Citizens Financial Group Inc. (CFG) Company Bio
Citizens Financial Group, Inc. is an American bank headquartered in Providence, Rhode Island, which operates in the states of Connecticut, Delaware, Maine, Massachusetts, Michigan, New Hampshire, New Jersey, New York, Ohio, Pennsylvania, and Vermont. (Source:Wikipedia)
Latest CFG News From Around the Web
Below are the latest news stories about Citizens Financial Group Inc that investors may wish to consider to help them evaluate CFG as an investment opportunity.
Here's Why Citizens Financial Group (CFG) Looks Ripe for Bottom FishingCitizens Financial Group (CFG) appears to have found support after losing some value lately, as indicated by the formation of a hammer chart. In addition to this technical chart pattern, strong agreement among Wall Street analysts in revising earnings estimates higher enhances the stock's potential for a turnaround in the near term. |
Citizens Hosts Fifth Annual Small Business Community Champion Award ContestPROVIDENCE, R.I., February 24, 2022--Today Citizens announced it has opened its annual Small Business Community Champion Award Contest, which will again recognize the positive contributions small businesses make within their communities. Now in its fifth year, the contest will award $10,000 each to 30 small businesses across Citizens’ footprint, including at least ten minority-owned and ten women-owned businesses, to help further strengthen their communities and their businesses. The contest is |
Citizens Financial Group to Participate at the 2022 RBC Capital Markets Financial Institutions ConferencePROVIDENCE, R.I., February 24, 2022--Citizens Financial Group to Participate at the 2022 RBC Capital Markets Financial Institutions Conference |
Citizens (CFG) Closes Buyout of 80 HSBC East Coast BranchesCitizens Financia's (CFG) acquisition of 80 east coast branches and the national online deposit business from HSBC expands its physical presence in strategic markets and enhances the balance sheet. |
Has Citizens Financial Group (CFG) Outpaced Other Finance Stocks This Year?Here is how Citizens Financial Group (CFG) and Atlantic Union (AUB) have performed compared to their sector so far this year. |
CFG Price Returns
1-mo | -12.85% |
3-mo | -27.93% |
6-mo | -22.05% |
1-year | -19.62% |
3-year | 24.29% |
5-year | 32.02% |
YTD | -18.16% |
2021 | 37.02% |
2020 | -6.73% |
2019 | 41.84% |
2018 | -27.43% |
2017 | 19.91% |
CFG Dividends
Ex-Dividend Date | Type | Payout Amount | Change | ||||||
---|---|---|---|---|---|---|---|---|---|
Loading, please wait... |
Continue Researching CFG
Want to do more research on Citizens Financial Group Inc's stock and its price? Try the links below:Citizens Financial Group Inc (CFG) Stock Price | Nasdaq
Citizens Financial Group Inc (CFG) Stock Quote, History and News - Yahoo Finance
Citizens Financial Group Inc (CFG) Stock Price and Basic Information | MarketWatch
Loading social stream, please wait...