
TCG BDC, Inc. (CGBD): Price and Financial Metrics
CGBD Price/Volume Stats
| Current price | $18.30 | 52-week high | $18.74 |
| Prev. close | $18.16 | 52-week low | $13.31 |
| Day low | $18.03 | Volume | 134,381 |
| Day high | $18.33 | Avg. volume | 215,223 |
| 50-day MA | $17.95 | Dividend yield | 8.83% |
| 200-day MA | $16.14 | Market Cap | 929.55M |
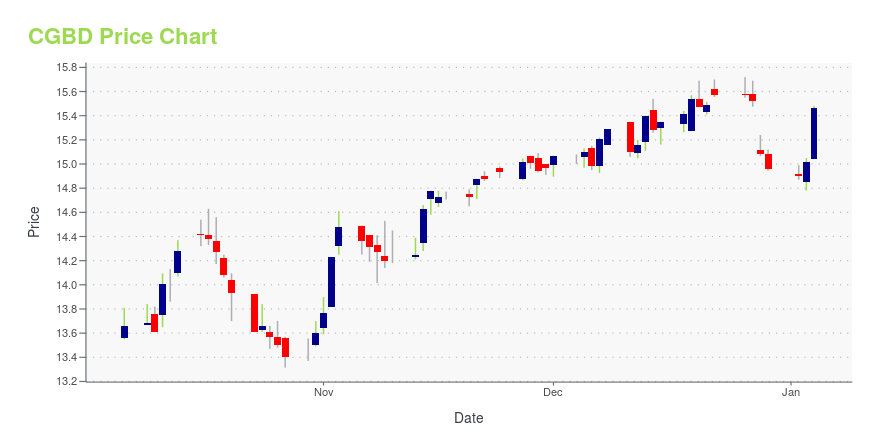
CGBD Stock Price Chart Interactive Chart >
TCG BDC, Inc. (CGBD) Company Bio
TCG BDC, Inc. is a non-diversified closed-end investment company. The fund operates as a business development company. The company provides debt investments in the U.S. middle market companies. It also invests in first lien and second lien senior secured loans; middle market junior loans, such as corporate mezzanine loans, equity co-investments, syndicated first lien and second lien senior secured loans, high-yield bonds, structured finance obligations, and other opportunistic investments. The company was founded in 2012 and is headquartered in New York, New York.
Latest CGBD News From Around the Web
Below are the latest news stories about CARLYLE SECURED LENDING INC that investors may wish to consider to help them evaluate CGBD as an investment opportunity.
Carlyle Secured Lending, Inc. Prices Public Offering of 8.20% Notes Due 2028NEW YORK, Nov. 13, 2023 (GLOBE NEWSWIRE) -- Carlyle Secured Lending, Inc. (Nasdaq: CGBD) (the "Company") today announced that it has priced an underwritten public offering of $75.0 million aggregate principal amount of 8.20% unsecured notes due 2028 (the "Notes"). The Notes will mature on December 1, 2028 and may be redeemed in whole or in part at any time or from time to time at the Company’s option on or after December 1, 2025. The Notes will bear interest at a rate of 8.20% per year payable q |
Carlyle Secured Lending, Inc. Announces Third Quarter 2023 Financial Results, Declares Fourth Quarter 2023 Dividends of $0.44 Per Common ShareNEW YORK, Nov. 07, 2023 (GLOBE NEWSWIRE) -- Carlyle Secured Lending, Inc. (together with its consolidated subsidiaries, “we,” “us,” “our,” “CSL” or the “Company”) (NASDAQ: CGBD) today announced its financial results for its third quarter ended September 30, 2023. The full detailed presentation of CSL’s third quarter 2023 results can be viewed here. Aren LeeKong, CSL’s Chief Executive Officer said, “In the face of broader market volatility, we are pleased to see our disciplined and intentional ap |
Carlyle Secured Lending, Inc. Schedules Third Quarter 2023 Financial Results and Investor Conference CallNEW YORK, Oct. 13, 2023 (GLOBE NEWSWIRE) -- Carlyle Secured Lending, Inc. (“Carlyle Secured Lending”) (NASDAQ: CGBD) will host a conference call at 10:00 a.m. EDT on Wednesday, November 8, 2023 to announce its third quarter 2023 financial results. A news release containing the quarterly results will be issued after market close on Tuesday, November 7, 2023. The conference call will be available via public webcast via a link on Carlyle Secured Lending’s website at carlylesecuredlending.com and wi |
Carlyle Secured Lending, Inc. Announces Second Quarter 2023 Financial Results, Declares Third Quarter 2023 Dividends of $0.44 Per Common ShareNEW YORK, Aug. 08, 2023 (GLOBE NEWSWIRE) -- Carlyle Secured Lending, Inc. (together with its consolidated subsidiaries, “we,” “us,” “our,” “CSL” or the “Company”) (NASDAQ: CGBD) today announced its financial results for its second quarter ended June 30, 2023. The full detailed presentation of CSL’s second quarter 2023 results can be viewed here. Aren LeeKong, CSL’s Chief Executive Officer said, “In spite of a complex economic backdrop, our portfolio continues to generate attractive income for ou |
Carlyle Secured Lending, Inc. Schedules Second Quarter 2023 Financial Results and Investor Conference CallNEW YORK, July 13, 2023 (GLOBE NEWSWIRE) -- Carlyle Secured Lending, Inc. (“Carlyle Secured Lending”) (NASDAQ: CGBD) will host a conference call at 10:00 a.m. EDT on Wednesday, August 9, 2023 to announce its second quarter 2023 financial results. A news release containing the quarterly results will be issued after market close on Tuesday, August 8, 2023. The conference call will be available via public webcast via a link on Carlyle Secured Lending’s website at carlylesecuredlending.com and will |
CGBD Price Returns
| 1-mo | 3.28% |
| 3-mo | 9.93% |
| 6-mo | 23.97% |
| 1-year | 33.40% |
| 3-year | 94.93% |
| 5-year | 130.89% |
| YTD | 29.36% |
| 2023 | 18.01% |
| 2022 | 17.70% |
| 2021 | 49.48% |
| 2020 | -8.34% |
| 2019 | 21.62% |
CGBD Dividends
| Ex-Dividend Date | Type | Payout Amount | Change | ||||||
|---|---|---|---|---|---|---|---|---|---|
| Loading, please wait... | |||||||||
Continue Researching CGBD
Here are a few links from around the web to help you further your research on Tcg Bdc Inc's stock as an investment opportunity:Tcg Bdc Inc (CGBD) Stock Price | Nasdaq
Tcg Bdc Inc (CGBD) Stock Quote, History and News - Yahoo Finance
Tcg Bdc Inc (CGBD) Stock Price and Basic Information | MarketWatch
Loading social stream, please wait...