Cognex Corp. (CGNX): Price and Financial Metrics

Cognex Corp. (CGNX): $38.40

0.70 (+1.86%)

POWR Rating

Component Grades

Momentum

C

Stability

C

Sentiment

Quality

A

Add CGNX to Watchlist
Sign Up

Industry: Industrial - Machinery

Industry

A

Ranked

#72 of 79

in industry

CGNX Price/Volume Stats

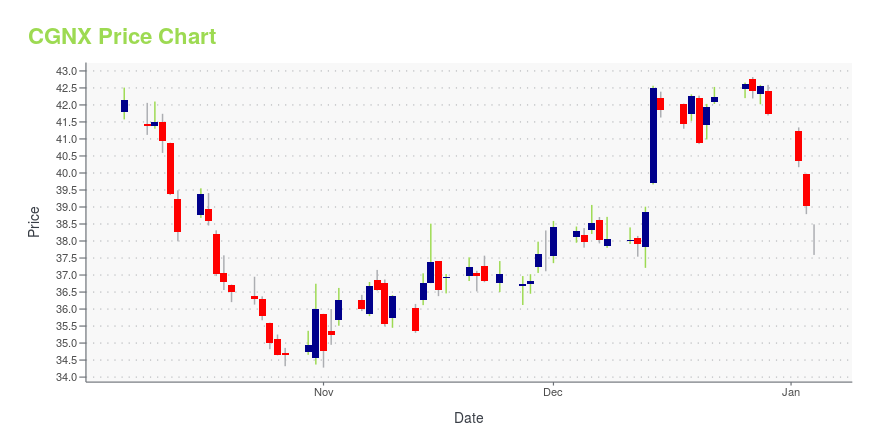
Current price $38.40 52-week high $59.51
Prev. close $37.70 52-week low $34.28
Day low $37.35 Volume 1,373,000
Day high $38.59 Avg. volume 913,820
50-day MA $38.12 Dividend yield 0.8%
200-day MA $47.28 Market Cap 6.61B

CGNX Stock Price Chart Interactive Chart >

CGNX POWR Grades

  • Quality is the dimension where CGNX ranks best; there it ranks ahead of 95.62% of US stocks.
  • CGNX's strongest trending metric is Value; it's been moving up over the last 177 days.
  • CGNX ranks lowest in Growth; there it ranks in the 2nd percentile.

CGNX Stock Summary

  • CGNX's went public 34.12 years ago, making it older than 88.9% of listed US stocks we're tracking.
  • The price/operating cash flow metric for COGNEX CORP is higher than 91.44% of stocks in our set with a positive cash flow.
  • With a year-over-year growth in debt of 105.06%, COGNEX CORP's debt growth rate surpasses 91.62% of about US stocks.
  • Stocks with similar financial metrics, market capitalization, and price volatility to COGNEX CORP are DLB, DGII, CTSO, AIRG, and VMEO.
  • Visit CGNX's SEC page to see the company's official filings. To visit the company's web site, go to www.cognex.com.

CGNX Valuation Summary

  • CGNX's price/sales ratio is 7.1; this is 222.73% higher than that of the median Technology stock.
  • CGNX's price/sales ratio has moved down 1.3 over the prior 243 months.

Below are key valuation metrics over time for CGNX.

Stock Date P/S P/B P/E EV/EBIT
CGNX 2023-11-03 7.1 4.2 39.7 32.8
CGNX 2023-11-02 6.9 4.1 38.6 31.8
CGNX 2023-11-01 6.8 4.0 38.0 31.4
CGNX 2023-10-31 7.0 4.2 39.4 32.6
CGNX 2023-10-30 6.7 4.1 34.9 30.7
CGNX 2023-10-27 6.7 4.0 34.6 30.4

CGNX Growth Metrics

    Its 3 year revenue growth rate is now at 33.35%.
  • Its 5 year net income to common stockholders growth rate is now at 6.04%.
  • Its 4 year net income to common stockholders growth rate is now at 6.04%.
CGNX's revenue has moved up $286,714,000 over the prior 34 months.

The table below shows CGNX's growth in key financial areas (numbers in millions of US dollars).

Date Revenue Operating Cash Flow Net Income to Common Stock
2022-12-31 1,006.09 243.406 215.525
2022-09-30 1,010.722 232.358 213.749
2022-06-30 1,085.948 212.969 258.669
2022-03-31 1,080.478 264.943 277.366
2021-12-31 1,037.098 314.065 279.881
2021-09-30 1,016.648 341.806 295.691

CGNX's Quality Factors

The “Quality” component of the POWR Ratings focuses on 31 different factors of a companies fundamentals and operational strength. Here are some key insights as we drill into the specifics of these quality attributes.
  • CGNX has a Quality Grade of A, ranking ahead of 95.89% of graded US stocks.
  • CGNX's asset turnover comes in at 0.522 -- ranking 45th of 75 Measuring and Control Equipment stocks.
  • DHR, COHR, and ONTO are the stocks whose asset turnover ratios are most correlated with CGNX.

The table below shows CGNX's key quality metrics over time.

Period Asset Turnover Gross Margin ROIC
2021-10-03 0.522 0.741 0.248
2021-07-04 0.504 0.758 0.260
2021-04-04 0.458 0.752 0.190
2020-12-31 0.422 0.745 0.148
2020-09-27 0.390 0.741 0.111
2020-06-28 0.389 0.733 0.074

CGNX Price Target

For more insight on analysts targets of CGNX, see our CGNX price target page. And for a list of of all stocks sorted by upside potential based on analyst target price, see our Top Price Target page.

Average Price Target $92.57 Average Broker Recommendation 1.91 (Hold)

Cognex Corp. (CGNX) Company Bio


Cognex Corporation is an American manufacturer of machine vision systems, software and sensors used in automated manufacturing to inspect and identify parts, detect defects, verify product assembly, and guide assembly robots. Cognex is headquartered in Natick, Massachusetts, USA and has offices in more than 20 countries. (Source:Wikipedia)


CGNX Latest News Stream


Event/Time News Detail
Loading, please wait...

CGNX Latest Social Stream


Loading social stream, please wait...

View Full CGNX Social Stream

Latest CGNX News From Around the Web

Below are the latest news stories about COGNEX CORP that investors may wish to consider to help them evaluate CGNX as an investment opportunity.

Forget 3M, Buy This Hot Growth Stock Instead

On a risk/reward basis, I think machine vision company Cognex (NASDAQ: CGNX) is a better buy than industrial conglomerate 3M (NYSE: MMM) right now. For that reason alone, I think Cognex is the better buy. 3M is set to deliver an organic sales growth decline of 3% for the full year (a figure at the low end of its initial guidance range of flat sales on 2022 to a 3% decline), and Wall Street analysts believe Cognex's full-year sales will decline by 17.5% compared to 2022.

Yahoo | November 23, 2023

Are Cognex Corporation's (NASDAQ:CGNX) Fundamentals Good Enough to Warrant Buying Given The Stock's Recent Weakness?

Cognex (NASDAQ:CGNX) has had a rough three months with its share price down 21%. However, stock prices are usually...

Yahoo | November 21, 2023

Here's Why Cognex Stock Crashed in October

Shares in machine vision company Cognex Corporation (NASDAQ: CGNX) declined 15.2% in October, according to data provided by S&P Global Market Intelligence. Revenue declined 6% year over year in the quarter, and CEO Robert Willett spoke of a "challenging operating environment" on the earnings call. Cognex's main end markets are consumer electronics, logistics, and automotives.

Yahoo | November 4, 2023

Should You Think About Buying Cognex Corporation (NASDAQ:CGNX) Now?

While Cognex Corporation ( NASDAQ:CGNX ) might not be the most widely known stock at the moment, it received a lot of...

Yahoo | November 1, 2023

2 Little-Known Artificial Intelligence (AI) Growth Stocks to Buy Before They Soar 43% and 50%, According to Wall Street

If Wall Street analysts are correct, these artificial intelligence stocks are headed higher in the next year.

Yahoo | November 1, 2023

Read More 'CGNX' Stories Here

CGNX Price Returns

1-mo 6.11%
3-mo N/A
6-mo -30.47%
1-year -23.87%
3-year -46.36%
5-year -10.39%
YTD -17.97%
2022 -39.11%
2021 -2.85%
2020 47.69%
2019 45.54%
2018 -36.53%

CGNX Dividends

Ex-Dividend Date Type Payout Amount Change
Loading, please wait...
View Full CGNX Dividend History

Get Free Updates

Join thousands of investors who get the latest news, insights and top rated picks from StockNews.com!