Chemed Corp (CHE): Price and Financial Metrics
CHE Price/Volume Stats
Current price | $533.77 | 52-week high | $570.17 |
Prev. close | $529.45 | 52-week low | $430.16 |
Day low | $527.48 | Volume | 97,000 |
Day high | $534.52 | Avg. volume | 69,737 |
50-day MA | $545.11 | Dividend yield | 0.28% |
200-day MA | $504.25 | Market Cap | 8.02B |
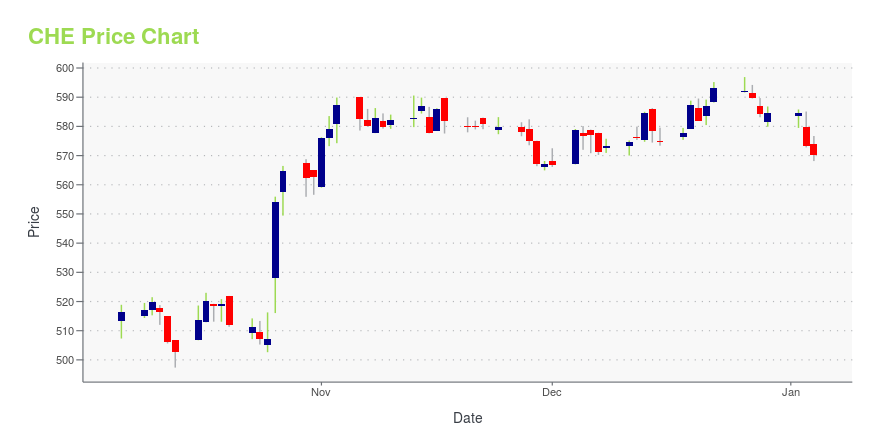
CHE Stock Price Chart Interactive Chart >
CHE POWR Grades
- CHE scores best on the Stability dimension, with a Stability rank ahead of 95.22% of US stocks.
- The strongest trend for CHE is in Stability, which has been heading up over the past 179 days.
- CHE ranks lowest in Momentum; there it ranks in the 4th percentile.
CHE Stock Summary
- CHEMED CORP's stock had its IPO on January 1, 1986, making it an older stock than 93.61% of US equities in our set.
- With a year-over-year growth in debt of -38.15%, CHEMED CORP's debt growth rate surpasses just 8.12% of about US stocks.
- In terms of volatility of its share price, CHE is more volatile than merely 11.66% of stocks we're observing.
- If you're looking for stocks that are quantitatively similar to CHEMED CORP, a group of peers worth examining would be MEI, NVEE, MLI, G, and JHG.
- Visit CHE's SEC page to see the company's official filings. To visit the company's web site, go to www.chemed.com.
CHE Valuation Summary
- CHE's price/earnings ratio is 33.7; this is 39.83% higher than that of the median Healthcare stock.
- CHE's price/earnings ratio has moved up 130.3 over the prior 243 months.
Below are key valuation metrics over time for CHE.
Stock | Date | P/S | P/B | P/E | EV/EBIT |
---|---|---|---|---|---|
CHE | 2023-05-23 | 3.7 | 9.2 | 33.7 | 25.5 |
CHE | 2023-05-22 | 3.7 | 9.2 | 33.9 | 25.6 |
CHE | 2023-05-19 | 3.7 | 9.2 | 33.8 | 25.5 |
CHE | 2023-05-18 | 3.7 | 9.2 | 33.6 | 25.4 |
CHE | 2023-05-17 | 3.7 | 9.2 | 33.9 | 25.6 |
CHE | 2023-05-16 | 3.8 | 9.3 | 34.1 | 25.8 |
CHE Growth Metrics
- Its 2 year net cashflow from operations growth rate is now at -4.42%.
- The year over year price growth rate now stands at 3.1%.
- The 4 year revenue growth rate now stands at 25.12%.

The table below shows CHE's growth in key financial areas (numbers in millions of US dollars).
Date | Revenue | Operating Cash Flow | Net Income to Common Stock |
---|---|---|---|
2022-12-31 | 2,134.963 | 309.886 | 249.624 |
2022-09-30 | 2,129.287 | 273.257 | 262.123 |
2022-06-30 | 2,141.482 | 334.228 | 277.253 |
2022-03-31 | 2,142.45 | 302.968 | 267.319 |
2021-12-31 | 2,139.261 | 308.597 | 268.55 |
2021-09-30 | 2,131.572 | 331.904 | 307.677 |
CHE's Quality Factors
The “Quality” component of the POWR Ratings focuses on 31 different factors of a companies fundamentals and operational strength. Here are some key insights as we drill into the specifics of these quality attributes.- CHE has a Quality Grade of A, ranking ahead of 96.99% of graded US stocks.
- CHE's asset turnover comes in at 1.524 -- ranking 7th of 81 Healthcare stocks.
- NTRA, RDNT, and VCYT are the stocks whose asset turnover ratios are most correlated with CHE.
The table below shows CHE's key quality metrics over time.
Period | Asset Turnover | Gross Margin | ROIC |
---|---|---|---|
2021-09-30 | 1.524 | 0.358 | 0.983 |
2021-06-30 | 1.503 | 0.356 | 1.007 |
2021-03-31 | 1.507 | 0.346 | 1.128 |
2020-12-31 | 1.549 | 0.337 | 0.967 |
2020-09-30 | 1.590 | 0.328 | 0.756 |
2020-06-30 | 1.595 | 0.317 | 0.666 |
CHE Price Target
For more insight on analysts targets of CHE, see our CHE price target page. And for a list of of all stocks sorted by upside potential based on analyst target price, see our Top Price Target page.
Average Price Target | $577.25 | Average Broker Recommendation | 1.25 (Strong Buy) |
Chemed Corp (CHE) Company Bio
Chemed Corporation provides hospice and palliative care services in the United States. It operates through two segments, VITAS and Roto-Rooter. The company offers its services to patients through a network of physicians, registered nurses, home health aides, social workers, clergy, and volunteers. It also provides plumbing, drain cleaning, water restoration, and other related services to residential and commercial customers. The company was founded in 1970 and is based in Cincinnati, Ohio.
Latest CHE News From Around the Web
Below are the latest news stories about CHEMED CORP that investors may wish to consider to help them evaluate CHE as an investment opportunity.
7 Stocks That Wall Street Analysts Are Loving in MayThough not perfect, an analyst rating can indicate where institutional investor sentiment lies; here are seven stocks that analysts love |
Chemed Corporation Holds Annual Meeting of Stockholders; Board Declares Quarterly DividendCINCINNATI, May 15, 2023--Stockholders of Chemed Corporation (NYSE:CHE) today elected a slate of 10 directors at the Company’s 2023 annual stockholders’ meeting. New to the Board is Eileen McCarthy, Senior Vice President of UiPath, Inc. (NYSE: PATH). |
Chemed Corporation to Present at the 2023 RBC Global Healthcare ConferenceCINCINNATI, May 10, 2023--Chemed Corporation (NYSE:CHE) today announced that it will deliver a presentation at the RBC Capital Markets Global Healthcare Conference on Wednesday, May 17, 2023, at approximately 2:35 p.m. (ET) at The InterContinental New York Barclay Hotel in New York City. |
DVA vs. CHE: Which Stock Should Value Investors Buy Now?DVA vs. CHE: Which Stock Is the Better Value Option? |
Chemed Corporation to Present at the Bank of America Merrill Lynch 2023 Health Care ConferenceCINCINNATI, May 03, 2023--Chemed Corporation (NYSE:CHE) today announced that it will deliver a presentation at the Bank of America Merrill Lynch 2023 Health Care Conference on Wednesday, May 10, 2023, at 10:40 AM (PDT) at the Encore at the Wynn Las Vegas. |
CHE Price Returns
1-mo | -2.58% |
3-mo | 2.43% |
6-mo | 1.99% |
1-year | 12.24% |
3-year | 14.60% |
5-year | 64.84% |
YTD | 4.72% |
2022 | -3.22% |
2021 | -0.38% |
2020 | 21.59% |
2019 | 55.58% |
2018 | 17.01% |
CHE Dividends
Ex-Dividend Date | Type | Payout Amount | Change | ||||||
---|---|---|---|---|---|---|---|---|---|
Loading, please wait... |
Continue Researching CHE
Want to do more research on Chemed Corp's stock and its price? Try the links below:Chemed Corp (CHE) Stock Price | Nasdaq
Chemed Corp (CHE) Stock Quote, History and News - Yahoo Finance
Chemed Corp (CHE) Stock Price and Basic Information | MarketWatch
Loading social stream, please wait...