Chico's FAS, Inc. (CHS): Price and Financial Metrics
CHS Price/Volume Stats
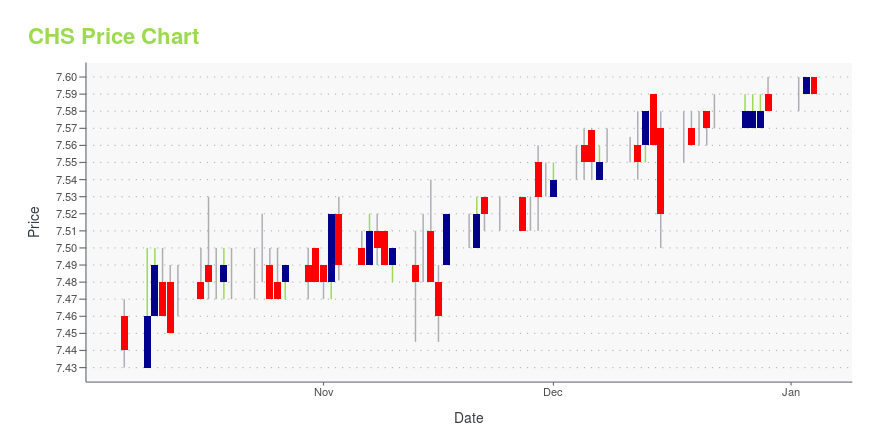
Current price | $5.11 | 52-week high | $7.30 |
Prev. close | $4.51 | 52-week low | $4.33 |
Day low | $4.56 | Volume | 3,632,500 |
Day high | $5.16 | Avg. volume | 2,168,548 |
50-day MA | $5.18 | Dividend yield | N/A |
200-day MA | $5.43 | Market Cap | 631.17M |
CHS Stock Price Chart Interactive Chart >
CHS POWR Grades
- CHS scores best on the Quality dimension, with a Quality rank ahead of 98.09% of US stocks.
- CHS's strongest trending metric is Stability; it's been moving up over the last 179 days.
- CHS ranks lowest in Momentum; there it ranks in the 17th percentile.
CHS Stock Summary
- CHICO'S FAS INC's capital turnover -- a measure of revenue relative to shareholder's equity -- is better than 93.31% of US listed stocks.
- CHS's price/sales ratio is 0.31; that's higher than the P/S ratio of just 10.86% of US stocks.
- In terms of twelve month growth in earnings before interest and taxes, CHICO'S FAS INC is reporting a growth rate of 113.49%; that's higher than 88.52% of US stocks.
- Stocks that are quantitatively similar to CHS, based on their financial statements, market capitalization, and price volatility, are BBW, GCO, TSRI, HSON, and ASO.
- CHS's SEC filings can be seen here. And to visit CHICO'S FAS INC's official web site, go to www.chicosfas.com.
CHS Valuation Summary
- In comparison to the median Consumer Cyclical stock, CHS's price/earnings ratio is 58.21% lower, now standing at 5.6.
- Over the past 243 months, CHS's EV/EBIT ratio has gone down 9.7.
Below are key valuation metrics over time for CHS.
Stock | Date | P/S | P/B | P/E | EV/EBIT |
---|---|---|---|---|---|
CHS | 2023-05-19 | 0.3 | 1.8 | 5.6 | 7.1 |
CHS | 2023-05-18 | 0.3 | 1.9 | 5.9 | 7.3 |
CHS | 2023-05-17 | 0.3 | 1.9 | 6.0 | 7.4 |
CHS | 2023-05-16 | 0.3 | 1.9 | 5.7 | 7.2 |
CHS | 2023-05-15 | 0.3 | 1.9 | 5.8 | 7.3 |
CHS | 2023-05-12 | 0.3 | 1.9 | 5.8 | 7.3 |
CHS Growth Metrics
- Its 3 year price growth rate is now at 42.55%.
- The year over year cash and equivalents growth rate now stands at 24.15%.
- Its year over year price growth rate is now at -6.24%.

The table below shows CHS's growth in key financial areas (numbers in millions of US dollars).
Date | Revenue | Operating Cash Flow | Net Income to Common Stock |
---|---|---|---|
2022-09-30 | 2,114.23 | 57.936 | 112.246 |
2022-06-30 | 2,049.542 | 104.58 | 105.853 |
2022-03-31 | 1,962.881 | 66.828 | 90.079 |
2021-12-31 | 1,809.927 | 62.611 | 46.218 |
2021-09-30 | 1,699.861 | 54.354 | -43.657 |
2021-06-30 | 1,597.633 | 26.417 | -117.751 |
CHS's Quality Factors
The “Quality” component of the POWR Ratings focuses on 31 different factors of a companies fundamentals and operational strength. Here are some key insights as we drill into the specifics of these quality attributes.- CHS has a Quality Grade of B, ranking ahead of 81.73% of graded US stocks.
- CHS's asset turnover comes in at 1.25 -- ranking 107th of 165 Retail stocks.
- URBN, AEO, and EXPR are the stocks whose asset turnover ratios are most correlated with CHS.
The table below shows CHS's key quality metrics over time.
Period | Asset Turnover | Gross Margin | ROIC |
---|---|---|---|
2021-07-31 | 1.250 | 0.287 | -0.073 |
2021-05-01 | 1.086 | 0.225 | -0.131 |
2021-01-30 | 0.963 | 0.139 | -0.275 |
2020-10-31 | 1.016 | 0.193 | -0.236 |
2020-08-01 | 1.070 | 0.235 | -0.193 |
2020-05-02 | 1.157 | 0.278 | -0.155 |
CHS Price Target
For more insight on analysts targets of CHS, see our CHS price target page. And for a list of of all stocks sorted by upside potential based on analyst target price, see our Top Price Target page.
Average Price Target | $5.63 | Average Broker Recommendation | 2 (Hold) |
Chico's FAS, Inc. (CHS) Company Bio
Chico's FAS is a specialty retailer of women's private branded, sophisticated, casual-to-dressy clothing, intimates, complementary accessories, and other non-clothing items. The company was founded in 1983 and is based in Fort Myers, Florida.
Latest CHS News From Around the Web
Below are the latest news stories about CHICO'S FAS INC that investors may wish to consider to help them evaluate CHS as an investment opportunity.
When Should You Buy Chico's FAS, Inc. (NYSE:CHS)?Chico's FAS, Inc. ( NYSE:CHS ), is not the largest company out there, but it saw significant share price movement... |
Chico's FAS, Inc.'s (NYSE:CHS) Intrinsic Value Is Potentially 20% Below Its Share PriceKey Insights Using the 2 Stage Free Cash Flow to Equity, Chico's FAS fair value estimate is US$4.03 Chico's FAS is... |
Is Chico's FAS, Inc.'s (NYSE:CHS) Recent Stock Performance Influenced By Its Fundamentals In Any Way?Chico's FAS' (NYSE:CHS) stock is up by a considerable 14% over the past three months. We wonder if and what role the... |
Are Options Traders Betting on a Big Move in Chico's FAS (CHS) Stock?Investors need to pay close attention to Chico's FAS (CHS) stock based on the movements in the options market lately. |
Returns On Capital At Chico's FAS (NYSE:CHS) Have Hit The BrakesWhat are the early trends we should look for to identify a stock that could multiply in value over the long term... |
CHS Price Returns
1-mo | 0.79% |
3-mo | -16.37% |
6-mo | -11.44% |
1-year | 5.80% |
3-year | 179.23% |
5-year | -32.56% |
YTD | 3.86% |
2022 | -8.55% |
2021 | 238.36% |
2020 | -56.50% |
2019 | -26.13% |
2018 | -33.40% |
Continue Researching CHS
Want to see what other sources are saying about Chico'S Fas Inc's financials and stock price? Try the links below:Chico'S Fas Inc (CHS) Stock Price | Nasdaq
Chico'S Fas Inc (CHS) Stock Quote, History and News - Yahoo Finance
Chico'S Fas Inc (CHS) Stock Price and Basic Information | MarketWatch
Loading social stream, please wait...