Chuy's Holdings, Inc. (CHUY): Price and Financial Metrics
CHUY Price/Volume Stats
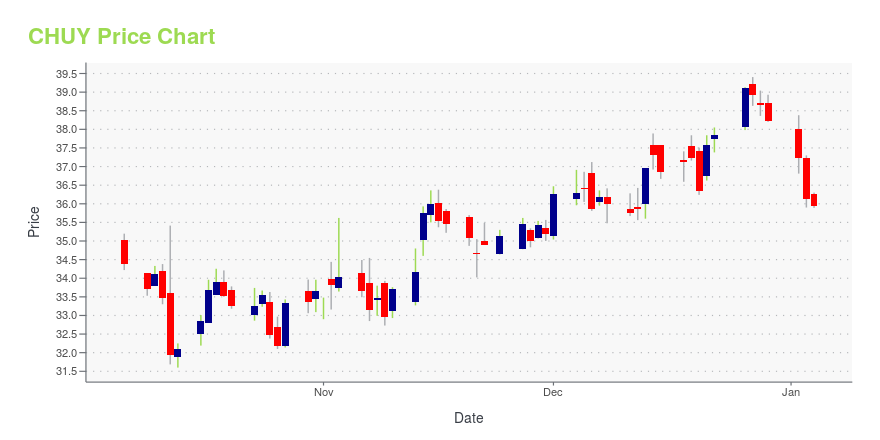
Current price | $41.70 | 52-week high | $43.17 |
Prev. close | $43.02 | 52-week low | $18.64 |
Day low | $40.52 | Volume | 284,834 |
Day high | $42.83 | Avg. volume | 100,349 |
50-day MA | $36.23 | Dividend yield | N/A |
200-day MA | $31.46 | Market Cap | 755.65M |
CHUY Stock Price Chart Interactive Chart >
CHUY POWR Grades
- Momentum is the dimension where CHUY ranks best; there it ranks ahead of 83.34% of US stocks.
- CHUY's strongest trending metric is Growth; it's been moving up over the last 179 days.
- CHUY's current lowest rank is in the Value metric (where it is better than 62.63% of US stocks).
CHUY Stock Summary
- With a price/earnings ratio of 28.79, CHUY'S HOLDINGS INC P/E ratio is greater than that of about 75.81% of stocks in our set with positive earnings.
- Of note is the ratio of CHUY'S HOLDINGS INC's sales and general administrative expense to its total operating expenses; 31.04% of US stocks have a lower such ratio.
- For CHUY, its debt to operating expenses ratio is greater than that reported by 73.85% of US equities we're observing.
- Stocks that are quantitatively similar to CHUY, based on their financial statements, market capitalization, and price volatility, are RPAY, BTTR, SYNH, NEPT, and DOMA.
- Visit CHUY's SEC page to see the company's official filings. To visit the company's web site, go to www.chuys.com.
CHUY Valuation Summary
- CHUY's price/sales ratio is 1.6; this is 100% higher than that of the median Consumer Cyclical stock.
- Over the past 132 months, CHUY's EV/EBIT ratio has gone up 6.8.
Below are key valuation metrics over time for CHUY.
Stock | Date | P/S | P/B | P/E | EV/EBIT |
---|---|---|---|---|---|
CHUY | 2023-05-19 | 1.6 | 2.7 | 29.3 | 32.6 |
CHUY | 2023-05-18 | 1.6 | 2.8 | 29.9 | 33.1 |
CHUY | 2023-05-17 | 1.6 | 2.7 | 29.5 | 32.7 |
CHUY | 2023-05-16 | 1.5 | 2.6 | 28.1 | 31.4 |
CHUY | 2023-05-15 | 1.5 | 2.6 | 28.4 | 31.6 |
CHUY | 2023-05-12 | 1.5 | 2.6 | 28.1 | 31.4 |
CHUY Growth Metrics
- Its 3 year net cashflow from operations growth rate is now at 1.69%.
- Its 5 year revenue growth rate is now at 23.36%.
- Its 2 year net cashflow from operations growth rate is now at 21.86%.

The table below shows CHUY's growth in key financial areas (numbers in millions of US dollars).
Date | Revenue | Operating Cash Flow | Net Income to Common Stock |
---|---|---|---|
2022-12-31 | 422.215 | 42.806 | 20.855 |
2022-09-30 | 416.779 | 45.663 | 24.37 |
2022-06-30 | 412.036 | 39.965 | 25.381 |
2022-03-31 | 409.243 | 44.316 | 29.04 |
2021-12-31 | 396.467 | 49.78 | 30.176 |
2021-09-30 | 376.51 | 46.855 | 25.966 |
CHUY's Quality Factors
The “Quality” component of the POWR Ratings focuses on 31 different factors of a companies fundamentals and operational strength. Here are some key insights as we drill into the specifics of these quality attributes.- CHUY has a Quality Grade of B, ranking ahead of 85.46% of graded US stocks.
- CHUY's asset turnover comes in at 0.715 -- ranking 33rd of 79 Restaraunts Hotels Motels stocks.
- TXRH, CAKE, and PLAY are the stocks whose asset turnover ratios are most correlated with CHUY.
The table below shows CHUY's key quality metrics over time.
Period | Asset Turnover | Gross Margin | ROIC |
---|---|---|---|
2021-06-27 | 0.715 | 0.240 | 0.047 |
2021-03-28 | 0.639 | 0.229 | 0.028 |
2020-12-27 | 0.670 | 0.199 | -0.015 |
2020-09-27 | 0.737 | 0.182 | -0.024 |
2020-06-28 | 0.812 | 0.167 | -0.035 |
2020-03-29 | 0.931 | 0.162 | -0.031 |
CHUY Price Target
For more insight on analysts targets of CHUY, see our CHUY price target page. And for a list of of all stocks sorted by upside potential based on analyst target price, see our Top Price Target page.
Average Price Target | $37.83 | Average Broker Recommendation | 1.75 (Moderate Buy) |
Chuy's Holdings, Inc. (CHUY) Company Bio
Chuy's Holdings owns and operates restaurants under the Chuys name. The company was founded in 1982 and is based in Austin, Texas.
Latest CHUY News From Around the Web
Below are the latest news stories about CHUY'S HOLDINGS INC that investors may wish to consider to help them evaluate CHUY as an investment opportunity.
Papa John's (PZZA) Acquires Drake Food's Restaurants in UKPapa John's (PZZA) announces the acquisition of the M25 division of Drake Food Service International in the U.K. |
Jack in the Box (JACK) Rides on Solid Comps Amid High CostsJack in the Box (JACK) benefits from robust same-store sales aided by franchised openings along with menu innovation and pricing. However, high costs and expenses hurt. |
Expansion Efforts Aid Dave & Buster's (PLAY) Despite Cost WoesDave & Buster's (PLAY) benefits from organic growth initiatives, expansion efforts, digitalization and the amusement strategy. |
Is Compagnie Financiere Richemont (CFRUY) Stock Outpacing Its Retail-Wholesale Peers This Year?Here is how Compagnie Financiere Richemont AG (CFRUY) and Chuy's Holdings (CHUY) have performed compared to their sector so far this year. |
Here's Why You Should Hold Darden Restaurants (DRI) Stock NowDarden Restaurants (DRI) benefits from business model enhancements, menu simplifications and technological enhancements in online ordering. |
CHUY Price Returns
1-mo | 18.91% |
3-mo | 21.15% |
6-mo | 38.22% |
1-year | 81.70% |
3-year | 127.37% |
5-year | 36.72% |
YTD | 47.35% |
2022 | -6.04% |
2021 | 13.70% |
2020 | 2.20% |
2019 | 46.11% |
2018 | -36.76% |
Continue Researching CHUY
Want to see what other sources are saying about Chuy'S Holdings Inc's financials and stock price? Try the links below:Chuy'S Holdings Inc (CHUY) Stock Price | Nasdaq
Chuy'S Holdings Inc (CHUY) Stock Quote, History and News - Yahoo Finance
Chuy'S Holdings Inc (CHUY) Stock Price and Basic Information | MarketWatch
Loading social stream, please wait...