Chimera Investment Corporation (CIM): Price and Financial Metrics

Chimera Investment Corporation (CIM): $4.42

0.10 (-2.21%)

POWR Rating

Component Grades

Momentum

C

Stability

C

Sentiment

Quality

C

Add CIM to Watchlist
Sign Up

Industry: REITs - Mortgage

Industry

D

Ranked

#12 of 27

in industry

CIM Price/Volume Stats

Current price $4.42 52-week high $6.49
Prev. close $4.52 52-week low $4.17
Day low $4.42 Volume 1,508,400
Day high $4.52 Avg. volume 2,103,696
50-day MA $4.65 Dividend yield 10%
200-day MA $5.24 Market Cap 1.07B

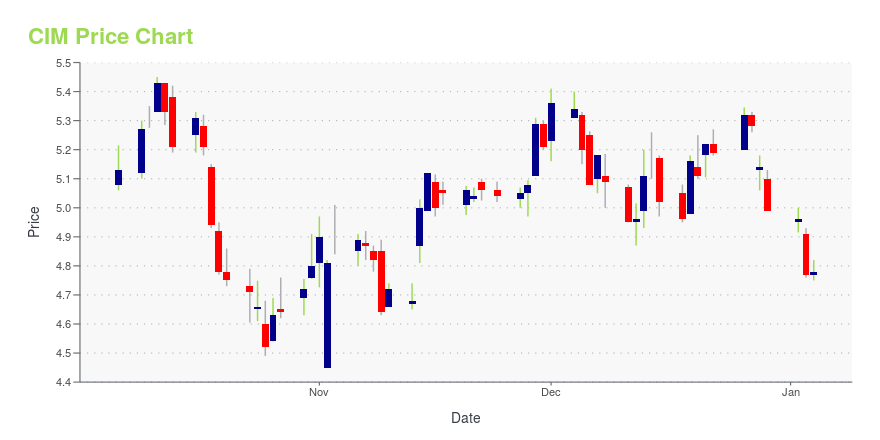
CIM Stock Price Chart Interactive Chart >

CIM POWR Grades

  • CIM scores best on the Value dimension, with a Value rank ahead of 83.6% of US stocks.
  • CIM's strongest trending metric is Growth; it's been moving down over the last 26 weeks.
  • CIM's current lowest rank is in the Sentiment metric (where it is better than 21.06% of US stocks).

CIM Stock Summary

  • The ratio of debt to operating expenses for CHIMERA INVESTMENT CORP is higher than it is for about 99.01% of US stocks.
  • Over the past twelve months, CIM has reported earnings growth of -132.46%, putting it ahead of merely 10.05% of US stocks in our set.
  • Revenue growth over the past 12 months for CHIMERA INVESTMENT CORP comes in at -172.1%, a number that bests merely 0.25% of the US stocks we're tracking.
  • Stocks that are quantitatively similar to CIM, based on their financial statements, market capitalization, and price volatility, are BLX, WHF, LFT, RWT, and NAVI.
  • CIM's SEC filings can be seen here. And to visit CHIMERA INVESTMENT CORP's official web site, go to www.chimerareit.com.

CIM Valuation Summary

  • In comparison to the median Real Estate stock, CIM's price/earnings ratio is 69.21% lower, now standing at 9.5.
  • Over the past 195 months, CIM's price/earnings ratio has gone up 241.7.

Below are key valuation metrics over time for CIM.

Stock Date P/S P/B P/E EV/EBIT
CIM 2023-12-29 3.3 0.5 9.5 58.5
CIM 2023-12-28 3.4 0.5 9.8 58.7
CIM 2023-12-27 3.5 0.5 10.1 58.9
CIM 2023-12-26 3.6 0.5 10.1 58.9
CIM 2023-12-22 3.5 0.5 9.9 58.8
CIM 2023-12-21 3.5 0.5 10.0 58.8

CIM Growth Metrics

    The 5 year cash and equivalents growth rate now stands at 216.74%.
  • Its 5 year revenue growth rate is now at -93.59%.
  • The year over year revenue growth rate now stands at -49.85%.
Over the past 70 months, CIM's revenue has gone down $1,183,050,000.

The table below shows CIM's growth in key financial areas (numbers in millions of US dollars).

Date Revenue Operating Cash Flow Net Income to Common Stock
2022-12-31 -375.065 325.722 -586.831
2022-09-30 -469.788 408.381 -666.267
2022-06-30 56.47 518.349 -148.654
2022-03-31 372.232 532.899 175.994
2021-12-31 810.065 519.182 596.35
2021-09-30 940.57 487.363 725.864

CIM's Quality Factors

The “Quality” component of the POWR Ratings focuses on 31 different factors of a companies fundamentals and operational strength. Here are some key insights as we drill into the specifics of these quality attributes.
  • CIM has a Quality Grade of B, ranking ahead of 83.94% of graded US stocks.
  • CIM's asset turnover comes in at 0.057 -- ranking 295th of 444 Trading stocks.
  • EQR, COHN, and CG are the stocks whose asset turnover ratios are most correlated with CIM.

The table below shows CIM's key quality metrics over time.

Period Asset Turnover Gross Margin ROIC
2021-09-30 0.057 1 0.028
2021-06-30 0.057 1 0.028
2021-03-31 0.042 1 0.020
2020-12-31 0.012 1 0.003
2020-09-30 0.009 1 0.002
2020-06-30 -0.003 1 -0.005

CIM Price Target

For more insight on analysts targets of CIM, see our CIM price target page. And for a list of of all stocks sorted by upside potential based on analyst target price, see our Top Price Target page.

Average Price Target $13.44 Average Broker Recommendation 2 (Hold)

Chimera Investment Corporation (CIM) Company Bio


Chimera Investment Corporation invests in residential mortgage loans, residential mortgage-backed securities, real estate-related securities and various other asset classes. The company was founded in 2007 and is based in New York, New York.


CIM Latest News Stream


Event/Time News Detail
Loading, please wait...

CIM Latest Social Stream


Loading social stream, please wait...

View Full CIM Social Stream

Latest CIM News From Around the Web

Below are the latest news stories about CHIMERA INVESTMENT CORP that investors may wish to consider to help them evaluate CIM as an investment opportunity.

7 Monthly Dividend Stocks to Buy and Hold for Steady Returns

One of the best ways to protect your portfolio – and generate consistent income – is with these top monthly dividend stocks.

Ian Cooper on InvestorPlace | November 27, 2023

Individual investors account for 51% of Chimera Investment Corporation's (NYSE:CIM) ownership, while institutions account for 48%

Key Insights The considerable ownership by individual investors in Chimera Investment indicates that they collectively...

Yahoo | November 24, 2023

10 Stocks Billionaire Leon Cooperman Just Bought and Sold

In this article, we discuss 10 Stocks billionaire Leon Cooperman just bought and sold. If you want to read about more stocks in this selection, head directly to 5 Stocks Billionaire Leon Cooperman Just Bought and Sold. Leon Cooperman established Omega Advisors in 1991, achieving an average annual return of 12.5% by focusing on undervalued […]

Yahoo | November 21, 2023

Chimera Investment Corporation (NYSE:CIM) Q3 2023 Earnings Call Transcript

Chimera Investment Corporation (NYSE:CIM) Q3 2023 Earnings Call Transcript November 2, 2023 Chimera Investment Corporation beats earnings expectations. Reported EPS is $0.13, expectations were $0.12. Operator: Greetings. Welcome to the Chimera Investment Corporation Third Quarter 2023 Earnings Call. [Operator Instructions]. At this time, I would like to hand the call over to Victor Falvo, Head […]

Yahoo | November 4, 2023

Q3 2023 Chimera Investment Corp Earnings Call

Q3 2023 Chimera Investment Corp Earnings Call

Yahoo | November 3, 2023

Read More 'CIM' Stories Here

CIM Price Returns

1-mo -0.23%
3-mo -11.66%
6-mo -18.14%
1-year -5.01%
3-year -50.10%
5-year -58.29%
YTD -11.42%
2023 2.95%
2022 -57.95%
2021 60.73%
2020 -42.97%
2019 27.65%

CIM Dividends

Ex-Dividend Date Type Payout Amount Change
Loading, please wait...
View Full CIM Dividend History

Get Free Updates

Join thousands of investors who get the latest news, insights and top rated picks from StockNews.com!