City Office REIT, Inc. (CIO): Price and Financial Metrics
CIO Stock Summary
- Of note is the ratio of City Office REIT Inc's sales and general administrative expense to its total operating expenses; just 7.23% of US stocks have a lower such ratio.
- For CIO, its debt to operating expenses ratio is greater than that reported by 90.75% of US equities we're observing.
- City Office REIT Inc's shareholder yield -- a measure of how much capital is returned to stockholders via dividends and buybacks -- is 15.38%, greater than the shareholder yield of 88.68% of stocks in our set.
- Stocks that are quantitatively similar to CIO, based on their financial statements, market capitalization, and price volatility, are AMH, RPAI, PEI, EPR, and KRG.
- CIO's SEC filings can be seen here. And to visit City Office REIT Inc's official web site, go to www.cityofficereit.com.
CIO Stock Price Chart Interactive Chart >
CIO Price/Volume Stats
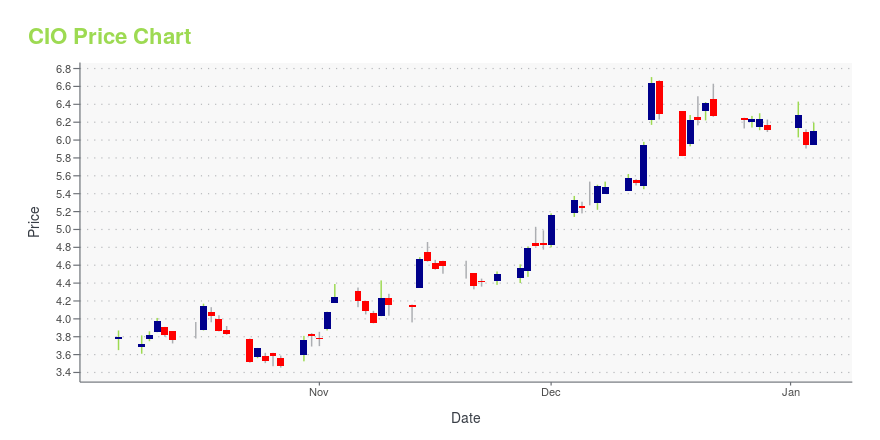
Current price | $10.69 | 52-week high | $11.83 |
Prev. close | $10.92 | 52-week low | $6.12 |
Day low | $10.57 | Volume | 202,800 |
Day high | $11.06 | Avg. volume | 241,886 |
50-day MA | $9.91 | Dividend yield | 5.49% |
200-day MA | $8.98 | Market Cap | 463.91M |
City Office REIT, Inc. (CIO) Company Bio
City Office REIT, Inc is an equity real estate investment trust. The fund invests in the real estate markets of the United States. It acquires, own and operate high-quality office properties. The company was founded in 2013 and is based in Vancouver, BC.
CIO Price Forecast Based on DCF Valuation
Current Price | DCF Fair Value Target: | Forecasted Gain: |
$10.69 | $0.16 | -98% |
Below please find a table outlining a discounted cash flow forecast for CIO, in which we model out valuation assuming a variety of terminal growth rates. To summarize, we found that City Office REIT Inc ranked in the 6th percentile in terms of potential gain offered. Our DCF analysis suggests the stock is overvalued by about 98.17%. In terms of the factors that were most noteworthy in this DCF analysis for CIO, they are:
- Its compound free cash flow growth rate, as measured over the past 0.31 years, is -0.46% -- higher than only 2.92% of stocks in our DCF forecasting set.
- As a business, City Office REIT Inc experienced a tax rate of about 0% over the past twelve months; relative to its sector (Real Estate), this tax rate is higher than merely 0% of stocks generating free cash flow.
Terminal Growth Rate in Free Cash Flow | Return Relative to Current Share Price |
0% | -99% |
1% | -98% |
2% | -98% |
3% | -98% |
4% | -98% |
5% | -98% |
PEB, BNL, CDR, CLDT, and COR can be thought of as valuation peers to CIO, in the sense that they are in the Real Estate sector and have a similar price forecast based on DCF valuation.
Latest CIO News From Around the Web
Below are the latest news stories about City Office REIT Inc that investors may wish to consider to help them evaluate CIO as an investment opportunity.
A Few Wicked-Cheap REITsThere are just some meals that are perfect for cold, wintry days. They’re hot. They’re comforting. And, let’s face it, they’re filling in more ways than one. They satisfy our appetites and add a little more padding to our bodies to make it through the long, cold days. That’s why,... |
Franklin Street Properties: Upcoming Dispositions Will Reveal Strong Value PropositionThesis Franklin Street Properties (FSP) is an office REIT that owns properties in primarily sunbelt and mountain west secondary markets. Owning a mix of suburban and CBD properties, FSP’s markets are set to experience higher than average in-migration and job growth going forward. Many other office REITs share similar portfolio... |
City Office REIT Does Earnings Surprise History Hold Any Clue for Stock market Insights & financial analysisCity Office REIT announce their quarterly, annual earnings. See the latest EPS estimates. Listen to the conference call and remind yourself by… |
City Office REIT Announces $95.0 Million Property SaleCity Office REIT, Inc. (NYSE: CIO) announced that it has completed the sale of its Cherry Creek property in Denver, Colorado. |
Are Investors Undervaluing City Office REIT (CIO) Right Now?Here at Zacks, our focus is on the proven Zacks Rank system, which emphasizes earnings estimates and estimate revisions to find great stocks. Nevertheless, we are always paying attention to the latest value, growth, and momentum trends to underscore strong picks. |
CIO Price Returns
1-mo | 10.66% |
3-mo | 10.01% |
6-mo | 37.22% |
1-year | -3.83% |
3-year | 24.21% |
5-year | 28.89% |
YTD | 11.13% |
2020 | -22.24% |
2019 | 42.43% |
2018 | -15.06% |
2017 | 6.42% |
2016 | 16.87% |
CIO Dividends
Ex-Dividend Date | Type | Payout Amount | Change | ||||||
---|---|---|---|---|---|---|---|---|---|
Loading, please wait... |
Continue Researching CIO
Want to see what other sources are saying about City Office REIT Inc's financials and stock price? Try the links below:City Office REIT Inc (CIO) Stock Price | Nasdaq
City Office REIT Inc (CIO) Stock Quote, History and News - Yahoo Finance
City Office REIT Inc (CIO) Stock Price and Basic Information | MarketWatch
Get Free Updates
Join thousands of investors who get the latest news, insights and top rated picks from StockNews.com!
Loading social stream, please wait...