
CIRCOR International, Inc. (CIR): Price and Financial Metrics
CIR Price/Volume Stats
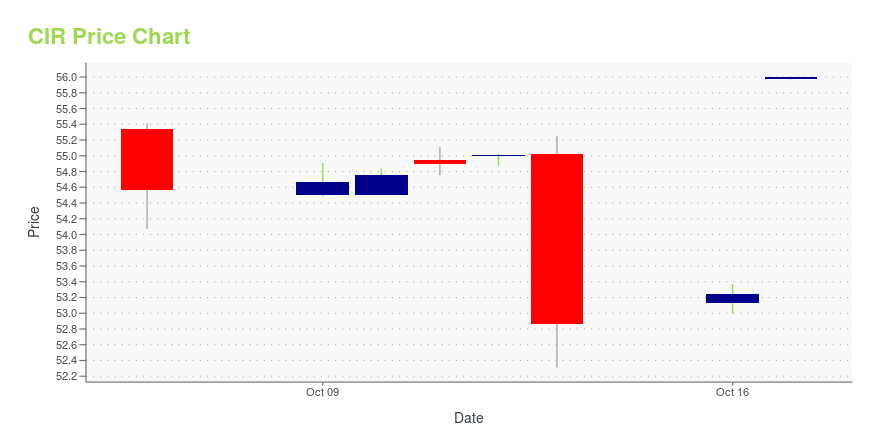
| Current price | $56.00 | 52-week high | $56.48 |
| Prev. close | $53.25 | 52-week low | $17.15 |
| Day low | $55.97 | Volume | 3,161,700 |
| Day high | $56.00 | Avg. volume | 301,073 |
| 50-day MA | $55.48 | Dividend yield | N/A |
| 200-day MA | $40.32 | Market Cap | 1.14B |
CIR Stock Price Chart Interactive Chart >
CIRCOR International, Inc. (CIR) Company Bio
Circor International designs, manufactures and markets highly engineered products and subsystems for markets including oil & gas, power generation and aerospace & defense. The company was founded in 1999 and is based in Burlington, Massachusetts.
Latest CIR News From Around the Web
Below are the latest news stories about CIRCOR INTERNATIONAL INC that investors may wish to consider to help them evaluate CIR as an investment opportunity.
CIRCOR International Announces Completion of Acquisition by KKR and Welcomes Dan Daniel as Board ChairNEW YORK & BURLINGTON, Mass., October 18, 2023--CIRCOR International, Inc. ("CIRCOR" or the "Company"), one of the world’s leading providers of mission critical flow control products and services for the Industrial and Aerospace & Defense markets, today announced the successful completion of its acquisition by investment affiliates of KKR for $56.00 per share. As a result of the completion of the transaction, CIRCOR common stock has ceased trading and will no longer be listed on the New York Sto |
Circor (CIR) Surges 5.2%: Is This an Indication of Further Gains?Circor (CIR) witnessed a jump in share price last session on above-average trading volume. The latest trend in earnings estimate revisions for the stock doesn't suggest further strength down the road. |
Floor & Decor Holdings Set to Join S&P MidCap 400; Vicor to Join S&P SmallCap 600Floor & Decor Holdings Inc. (NYSE:FND) will replace Vicor Corp. (NASD:VICR) in the S&P MidCap 400, and Vicor will replace CIRCOR International Inc. (NYSE:CIR) in the S&P SmallCap 600. KKR & Co. Inc. (NYSE: KKR) is acquiring CIRCOR International in a transaction expected to close October 18. Vicor is more representative of the small-cap market space. |
Unveiling Circor International (CIR)'s Value: Is It Really Priced Right? A Comprehensive GuideDeciphering the intrinsic value of Circor International Inc (CIR) based on GuruFocus' proprietary GF Value |
Implied Volatility Surging for On CIRCOR International (CIR) Stock OptionsInvestors need to pay close attention to CIRCOR International (CIR) stock based on the movements in the options market lately. |
CIR Price Returns
| 1-mo | N/A |
| 3-mo | N/A |
| 6-mo | N/A |
| 1-year | 0.72% |
| 3-year | 85.12% |
| 5-year | 43.77% |
| YTD | N/A |
| 2023 | 0.00% |
| 2022 | -11.85% |
| 2021 | -29.29% |
| 2020 | -16.87% |
| 2019 | 117.09% |
Continue Researching CIR
Want to do more research on Circor International Inc's stock and its price? Try the links below:Circor International Inc (CIR) Stock Price | Nasdaq
Circor International Inc (CIR) Stock Quote, History and News - Yahoo Finance
Circor International Inc (CIR) Stock Price and Basic Information | MarketWatch
Loading social stream, please wait...