Clorox Co. (CLX): Price and Financial Metrics
CLX Price/Volume Stats
Current price | $153.11 | 52-week high | $178.21 |
Prev. close | $152.74 | 52-week low | $114.68 |
Day low | $152.24 | Volume | 1,136,900 |
Day high | $153.87 | Avg. volume | 1,252,047 |
50-day MA | $150.74 | Dividend yield | 3.19% |
200-day MA | $145.58 | Market Cap | 19.00B |
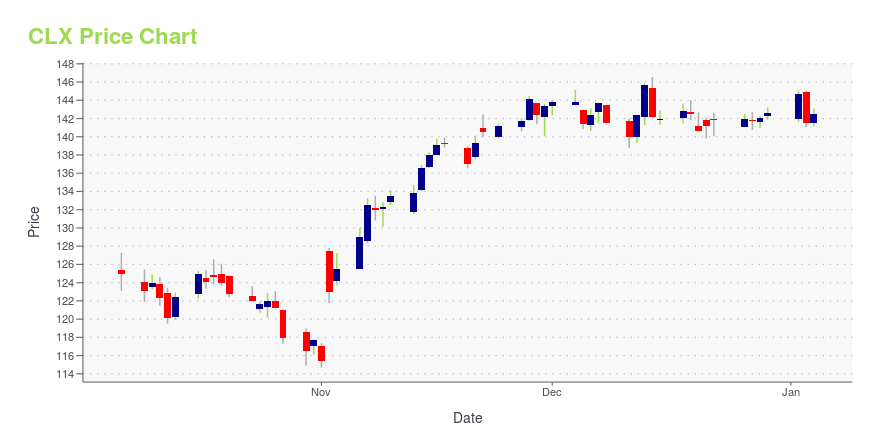
CLX Stock Price Chart Interactive Chart >
CLX POWR Grades
- CLX scores best on the Quality dimension, with a Quality rank ahead of 69.11% of US stocks.
- The strongest trend for CLX is in Growth, which has been heading down over the past 26 weeks.
- CLX's current lowest rank is in the Growth metric (where it is better than 23.23% of US stocks).
CLX Stock Summary
- The capital turnover (annual revenue relative to shareholder's equity) for CLX is -190.14 -- better than just 0.07% of US stocks.
- CLX's current price/earnings ratio is 204.15, which is higher than 97.22% of US stocks with positive earnings.
- Equity multiplier, or assets relative to shareholders' equity, comes in at 46.94 for CLOROX CO; that's greater than it is for 99.26% of US stocks.
- Stocks that are quantitatively similar to CLX, based on their financial statements, market capitalization, and price volatility, are TSE, KPLT, MAS, MCK, and KIRK.
- Visit CLX's SEC page to see the company's official filings. To visit the company's web site, go to www.thecloroxcompany.com.
CLX Valuation Summary
- In comparison to the median Consumer Defensive stock, CLX's price/earnings ratio is 878.95% higher, now standing at 204.6.
- Over the past 243 months, CLX's EV/EBIT ratio has gone up 74.9.
Below are key valuation metrics over time for CLX.
Stock | Date | P/S | P/B | P/E | EV/EBIT |
---|---|---|---|---|---|
CLX | 2023-12-22 | 2.5 | -475.6 | 204.6 | 89.4 |
CLX | 2023-12-21 | 2.5 | -473.3 | 203.6 | 89.0 |
CLX | 2023-12-20 | 2.5 | -471.4 | 202.8 | 88.7 |
CLX | 2023-12-19 | 2.5 | -477.9 | 205.6 | 89.7 |
CLX | 2023-12-18 | 2.5 | -478.7 | 206.0 | 89.9 |
CLX | 2023-12-15 | 2.5 | -475.8 | 204.7 | 89.4 |
CLX Growth Metrics
- Its 3 year cash and equivalents growth rate is now at 35.39%.
- Its year over year price growth rate is now at -21.49%.
- The 3 year net cashflow from operations growth rate now stands at -16.85%.
The table below shows CLX's growth in key financial areas (numbers in millions of US dollars).
Date | Revenue | Operating Cash Flow | Net Income to Common Stock |
---|---|---|---|
2022-12-31 | 7,065 | 951 | 435 |
2022-09-30 | 7,041 | 923 | 405 |
2022-06-30 | 7,107 | 786 | 462 |
2022-03-31 | 7,108 | 834 | 458 |
2021-12-31 | 7,080 | 869 | 247 |
2021-09-30 | 7,231 | 934 | 437 |
CLX's Quality Factors
The “Quality” component of the POWR Ratings focuses on 31 different factors of a companies fundamentals and operational strength. Here are some key insights as we drill into the specifics of these quality attributes.- CLX has a Quality Grade of B, ranking ahead of 82.7% of graded US stocks.
- CLX's asset turnover comes in at 1.117 -- ranking 18th of 50 Consumer Goods stocks.
- PG, SCL, and LZB are the stocks whose asset turnover ratios are most correlated with CLX.
The table below shows CLX's key quality metrics over time.
Period | Asset Turnover | Gross Margin | ROIC |
---|---|---|---|
2021-09-30 | 1.117 | 0.408 | 0.142 |
2021-06-30 | 1.112 | 0.436 | 0.211 |
2021-03-31 | 1.145 | 0.460 | 0.275 |
2020-12-31 | 1.171 | 0.468 | 0.359 |
2020-09-30 | 1.174 | 0.466 | 0.344 |
2020-06-30 | 1.173 | 0.456 | 0.289 |
CLX Price Target
For more insight on analysts targets of CLX, see our CLX price target page. And for a list of of all stocks sorted by upside potential based on analyst target price, see our Top Price Target page.
Average Price Target | $161.66 | Average Broker Recommendation | 2.09 (Hold) |
Clorox Co. (CLX) Company Bio
The Clorox Company (formerly Clorox Chemical Company) is an American global manufacturer and marketer of consumer and professional products. As of 2020 the Oakland, California based company had approximately 8,800 employees worldwide. Net sales for 2020 fiscal year were US$6.7 billion. Ranked annually since 2000, Clorox was named number 474 on Fortune magazine's 2020 Fortune 500 list. (Source:Wikipedia)
Latest CLX News From Around the Web
Below are the latest news stories about CLOROX CO that investors may wish to consider to help them evaluate CLX as an investment opportunity.
Clorox (CLX) Surpasses Market Returns: Some Facts Worth KnowingClorox (CLX) reachead $141.86 at the closing of the latest trading day, reflecting a +0.5% change compared to its last close. |
Clorox (CLX) Ascends But Remains Behind Market: Some Facts to NoteClorox (CLX) closed at $141.16 in the latest trading session, marking a +0.4% move from the prior day. |
Forever Favorites: 7 Dividend Stocks to Buy and Never SellSome investments just look after themselves. |
Clorox's (CLX) Growth Strategies Seem Encouraging: Here's WhyClorox's (CLX) IGNITE strategy bodes well. The company's pricing and cost-saving initiatives are aiding margins and, in turn, profitability. |
3 Passive Income Powerhouses to Buy Before the End of the YearAll three companies use dividends as a primary way to return value to shareholders. |
CLX Price Returns
1-mo | -0.24% |
3-mo | 8.29% |
6-mo | 18.99% |
1-year | 2.45% |
3-year | -13.46% |
5-year | 9.59% |
YTD | 8.29% |
2023 | 4.99% |
2022 | -17.00% |
2021 | -11.50% |
2020 | 34.46% |
2019 | 2.23% |
CLX Dividends
Ex-Dividend Date | Type | Payout Amount | Change | ||||||
---|---|---|---|---|---|---|---|---|---|
Loading, please wait... |
Continue Researching CLX
Want to see what other sources are saying about Clorox Co's financials and stock price? Try the links below:Clorox Co (CLX) Stock Price | Nasdaq
Clorox Co (CLX) Stock Quote, History and News - Yahoo Finance
Clorox Co (CLX) Stock Price and Basic Information | MarketWatch
Loading social stream, please wait...