
Commercial Metals Company (CMC): Price and Financial Metrics
CMC Price/Volume Stats
| Current price | $60.35 | 52-week high | $60.85 |
| Prev. close | $59.05 | 52-week low | $39.85 |
| Day low | $59.28 | Volume | 912,000 |
| Day high | $60.85 | Avg. volume | 899,595 |
| 50-day MA | $54.80 | Dividend yield | 1.24% |
| 200-day MA | $51.75 | Market Cap | 6.94B |
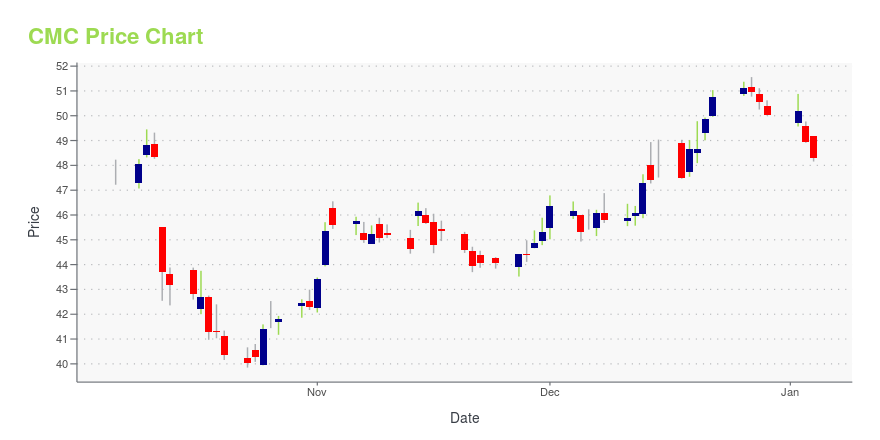
CMC Stock Price Chart Interactive Chart >
Commercial Metals Company (CMC) Company Bio
Commercial Metals manufactures, recycles, and markets steel and metal products, and related materials and services in the United States and internationally. The company was founded in 1915 and is based in Irving, Texas.
Latest CMC News From Around the Web
Below are the latest news stories about COMMERCIAL METALS CO that investors may wish to consider to help them evaluate CMC as an investment opportunity.
CMC Publishes 2023 Sustainability ReportCommercial Metals Company (NYSE: CMC) ("CMC" or the "Company") today published its Sustainability Report for fiscal 2023, showcasing the Company's key role in the circular economy and its industry-leading environmental performance. Today's publication, which can be found on CMC's sustainability website (esg.cmc.com), reaffirms CMC's commitment to transparent and regular reporting. |
Investors Don't See Light At End Of Commercial Metals Company's (NYSE:CMC) TunnelWhen close to half the companies in the United States have price-to-earnings ratios (or "P/E's") above 17x, you may... |
Commercial Metals (CMC) to Change Its Segmental ReportingCommercial Metals (CMC) realigns its reporting structure into three operating segments beginning first-quarter fiscal 2024. |
CMC Announces Changes to Segment ReportingCommercial Metals Company (NYSE: CMC) ("CMC" or the "Company") today announced that beginning with its first quarter of fiscal 2024, the Company will report financial results reflecting a realigned reporting structure, with three reportable segments: North America Steel Group, Europe Steel Group, and Emerging Businesses Group. |
U.S. Steel (X) Surges 6.1%: Is This an Indication of Further Gains?U.S. Steel (X) saw its shares surge in the last session with trading volume being higher than average. The latest trend in earnings estimate revisions may not translate into further price increase in the near term. |
CMC Price Returns
| 1-mo | 12.56% |
| 3-mo | 13.22% |
| 6-mo | 17.36% |
| 1-year | 9.69% |
| 3-year | 99.75% |
| 5-year | 264.38% |
| YTD | 21.77% |
| 2023 | 4.99% |
| 2022 | 35.05% |
| 2021 | 79.83% |
| 2020 | -5.45% |
| 2019 | 42.81% |
CMC Dividends
| Ex-Dividend Date | Type | Payout Amount | Change | ||||||
|---|---|---|---|---|---|---|---|---|---|
| Loading, please wait... | |||||||||
Continue Researching CMC
Want to do more research on COMMERCIAL METALS Co's stock and its price? Try the links below:COMMERCIAL METALS Co (CMC) Stock Price | Nasdaq
COMMERCIAL METALS Co (CMC) Stock Quote, History and News - Yahoo Finance
COMMERCIAL METALS Co (CMC) Stock Price and Basic Information | MarketWatch
Loading social stream, please wait...