CME Group Inc. CI A (CME): Price and Financial Metrics

CME Group Inc. CI A (CME): $213.04

3.39 (+1.62%)

POWR Rating

Component Grades

Momentum

B

Stability

C

Sentiment

Quality

C

Add CME to Watchlist
Sign Up

Industry: Financial Marketplaces

Industry

F

Ranked

#2 of 12

in industry

CME Price/Volume Stats

Current price $213.04 52-week high $223.80
Prev. close $209.65 52-week low $175.73
Day low $210.27 Volume 2,563,900
Day high $214.50 Avg. volume 1,776,883
50-day MA $214.05 Dividend yield 2.23%
200-day MA $207.86 Market Cap 76.69B

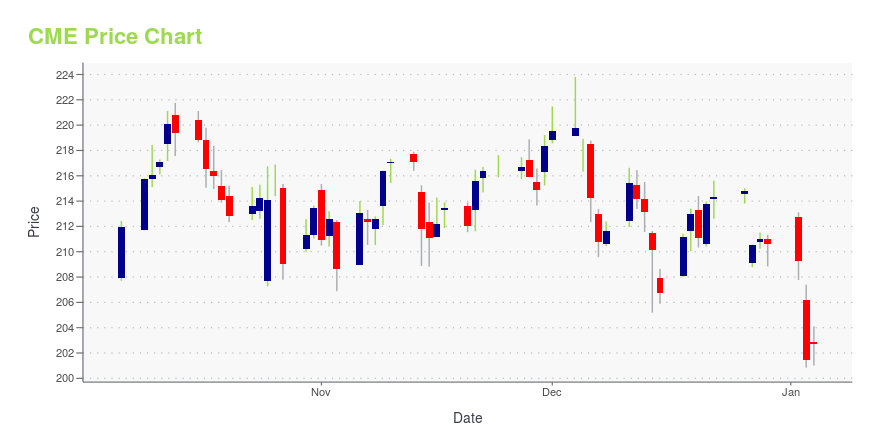
CME Stock Price Chart Interactive Chart >


CME Group Inc. CI A (CME) Company Bio


CME Group Inc. (Chicago Mercantile Exchange, Chicago Board of Trade, New York Mercantile Exchange, The Commodity Exchange) is an American global markets company. It is the world's largest financial derivatives exchange, and trades in asset classes that include agricultural products, currencies, energy, interest rates, metals, stock indexes and cryptocurrencies futures. The company offers futures contracts and options on futures using its CME Globex trading platforms, fixed income trading via BrokerTec and foreign exchange trading on the EBS platform. In addition, it operates a central counterparty clearing provider, CME Clearing. With a range of pre- and post-trade products and services underpinning the entire lifecycle of a trade, CME Group also offers optimization and reconciliation services through TriOptima, and trade processing services through Traiana. (Source:Wikipedia)


CME Latest News Stream


Event/Time News Detail
Loading, please wait...

CME Latest Social Stream


Loading social stream, please wait...

View Full CME Social Stream

Latest CME News From Around the Web

Below are the latest news stories about CME GROUP INC that investors may wish to consider to help them evaluate CME as an investment opportunity.

Bullish About 2024? CME's Charts Suggest Something Else

I miss those days - but now it provides electronic trading globally on its CME Globex platform. The trading volume has been more active the past three months and the On-Balance-Volume (OBV) line started to move sideways in September and declined in December. A weak OBV line suggests that traders are being more aggressive sellers than buyers.

Yahoo | December 27, 2023

CME Group Inc's Dividend Analysis

CME Group Inc (NASDAQ:CME) recently announced a dividend of $5.25 per share, payable on 2024-01-18, with the ex-dividend date set for 2023-12-27. Using the data from GuruFocus, let's look into CME Group Inc's dividend performance and assess its sustainability. What Does CME Group Inc Do?

Yahoo | December 26, 2023

Here's Why We're Wary Of Buying CME Group's (NASDAQ:CME) For Its Upcoming Dividend

CME Group Inc. ( NASDAQ:CME ) is about to trade ex-dividend in the next four days. The ex-dividend date occurs one day...

Yahoo | December 22, 2023

CME Group (CME) Benefitted from Unique Diversification

Mawer Investment Management, an asset management company, released its third quarter 2023 investor letter. A copy of the same can be downloaded here. In the third quarter, Mawer Investment Management’s International Equity Fund, U.S. Equity Fund, U.S. Mid Cap Equity Fund, Global Equity Fund, Global Small Cap Fund, Emerging Markets Equity Fund, EAFE Large Cap Fund, […]

Yahoo | December 21, 2023

CME Group Inc. Announces Fourth-Quarter and Year-End 2023 Earnings Release, Conference Call

CME Group Inc. will announce earnings for the fourth quarter and full year of 2023 before the markets open on Wednesday, February 14, 2024. Written highlights for the quarter will be posted on the company's website at 6:00 a.m. Central Time, the same time it provides its earnings press release. The company will also hold an investor conference call that day at 7:30 a.m. Central Time, at which time company executives will take analysts' questions.

Yahoo | December 20, 2023

Read More 'CME' Stories Here

CME Price Returns

1-mo -1.41%
3-mo 5.99%
6-mo 3.30%
1-year 17.64%
3-year 16.78%
5-year 46.75%
YTD 1.69%
2023 31.32%
2022 -22.89%
2021 29.47%
2020 -6.34%
2019 9.67%

CME Dividends

Ex-Dividend Date Type Payout Amount Change
Loading, please wait...
View Full CME Dividend History

Get Free Updates

Join thousands of investors who get the latest news, insights and top rated picks from StockNews.com!