Cummins Inc. (CMI): Price and Financial Metrics
CMI Price/Volume Stats
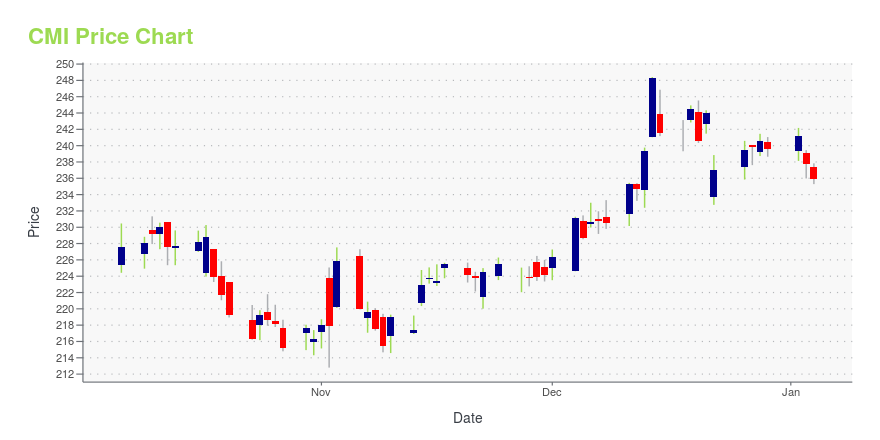
Current price | $228.81 | 52-week high | $265.28 |
Prev. close | $232.80 | 52-week low | $200.40 |
Day low | $228.74 | Volume | 639,800 |
Day high | $231.95 | Avg. volume | 967,259 |
50-day MA | $241.70 | Dividend yield | 2.86% |
200-day MA | $237.95 | Market Cap | 32.41B |
CMI Stock Price Chart Interactive Chart >
CMI POWR Grades
- CMI scores best on the Quality dimension, with a Quality rank ahead of 82.84% of US stocks.
- CMI's strongest trending metric is Momentum; it's been moving up over the last 179 days.
- CMI's current lowest rank is in the Stability metric (where it is better than 53.37% of US stocks).
CMI Stock Summary
- CMI has a market capitalization of $33,760,176,726 -- more than approximately 93.13% of US stocks.
- CUMMINS INC's stock had its IPO on January 1, 1986, making it an older stock than 93.16% of US equities in our set.
- In terms of volatility of its share price, CMI is more volatile than only 8.13% of stocks we're observing.
- Stocks with similar financial metrics, market capitalization, and price volatility to CUMMINS INC are DOW, BRKR, GTH, EMN, and NEON.
- CMI's SEC filings can be seen here. And to visit CUMMINS INC's official web site, go to www.cumminseurope.com.
CMI Valuation Summary
- In comparison to the median Industrials stock, CMI's price/sales ratio is 16.67% lower, now standing at 1.
- CMI's EV/EBIT ratio has moved down 15.8 over the prior 243 months.
Below are key valuation metrics over time for CMI.
Stock | Date | P/S | P/B | P/E | EV/EBIT |
---|---|---|---|---|---|
CMI | 2023-09-15 | 1 | 3.2 | 13.1 | 10.8 |
CMI | 2023-09-14 | 1 | 3.2 | 13.2 | 10.8 |
CMI | 2023-09-13 | 1 | 3.2 | 13.0 | 10.7 |
CMI | 2023-09-12 | 1 | 3.2 | 13.1 | 10.8 |
CMI | 2023-09-11 | 1 | 3.2 | 13.0 | 10.7 |
CMI | 2023-09-08 | 1 | 3.2 | 13.1 | 10.8 |
CMI Growth Metrics
- Its 5 year net income to common stockholders growth rate is now at 43.5%.
- Its 4 year net cashflow from operations growth rate is now at 53.49%.
- The 2 year price growth rate now stands at 25.48%.

The table below shows CMI's growth in key financial areas (numbers in millions of US dollars).
Date | Revenue | Operating Cash Flow | Net Income to Common Stock |
---|---|---|---|
2022-12-31 | 28,074 | 1,962 | 2,151 |
2022-09-30 | 26,154 | 1,877 | 1,914 |
2022-06-30 | 24,789 | 2,064 | 2,048 |
2022-03-31 | 24,314 | 2,081 | 1,946 |
2021-12-31 | 24,021 | 2,256 | 2,131 |
2021-09-30 | 24,001 | 2,666 | 2,238 |
CMI's Quality Factors
The “Quality” component of the POWR Ratings focuses on 31 different factors of a companies fundamentals and operational strength. Here are some key insights as we drill into the specifics of these quality attributes.- CMI has a Quality Grade of A, ranking ahead of 95.63% of graded US stocks.
- CMI's asset turnover comes in at 1.052 -- ranking 15th of 104 Machinery stocks.
- KMT, TNC, and DCI are the stocks whose asset turnover ratios are most correlated with CMI.
The table below shows CMI's key quality metrics over time.
Period | Asset Turnover | Gross Margin | ROIC |
---|---|---|---|
2021-10-03 | 1.052 | 0.239 | 0.195 |
2021-07-04 | 1.032 | 0.245 | 0.198 |
2021-04-04 | 0.955 | 0.243 | 0.177 |
2020-12-31 | 0.937 | 0.247 | 0.175 |
2020-09-27 | 0.958 | 0.248 | 0.163 |
2020-06-28 | 1.005 | 0.247 | 0.176 |
CMI Price Target
For more insight on analysts targets of CMI, see our CMI price target page. And for a list of of all stocks sorted by upside potential based on analyst target price, see our Top Price Target page.
Average Price Target | $284.81 | Average Broker Recommendation | 1.65 (Moderate Buy) |
Cummins Inc. (CMI) Company Bio
Cummins Inc. is an American multinational corporation that designs, manufactures, and distributes engines, filtration, and power generation products. Cummins also services engines and related equipment, including fuel systems, controls, air handling, filtration, emission control, electrical power generation systems, and trucks. (Source:Wikipedia)
Latest CMI News From Around the Web
Below are the latest news stories about CUMMINS INC that investors may wish to consider to help them evaluate CMI as an investment opportunity.
Hyliion and Cummins Receive Certification From the California Air Resource Board for the Hypertruck ERX Electric PowertrainAUSTIN, Texas, September 18, 2023--Hyliion Holdings Corp. (NYSE: HYLN) ("Hyliion"), a leader in electrified solutions for Class 8 semi-trucks, and Cummins Inc. (NYSE: CMI) ("Cummins"), a global power solutions provider, today announced the two companies together have successfully obtained the Dual Executive Order from the California Air Resources Board (CARB) for the Hypertruck ERX powertrain paired with the Cummins ISX12N engine. |
Cummins Plant Begins Building Prototype of Fuel Agnostic Engines To Prepare for ProductionNORTHAMPTON, MA / ACCESSWIRE / September 15, 2023 / Cummins Inc.CumminsAfter building its 5 millionth engine, Cummins Inc.'s Rocky Mount Engine Plant (RMEP) in North Carolina is continuing its long history of innovation in engine technology and manufacturing. ... |
Cummins (CMI) Outpaces Stock Market Gains: What You Should KnowCummins (CMI) closed the most recent trading day at $237.04, moving +1.49% from the previous trading session. |
Accelera by Cummins, Daimler Truck and PACCAR Form Joint Venture To Advance U.S. Battery Cell ProductionAccelera™ by Cummins, Daimler Trucks & Buses and PACCAR are partnering to accelerate and localize battery cell production and the battery supply chain in the United States. |
Terex Advance Signs Letter of Intent to Integrate and Offer Cummins X15HCOLUMBUS, Ind., September 11, 2023--Cummins Inc. (NYSE: CMI), a global power solutions provider and Terex® Advance, leading manufacturer of front-discharge concrete mixer trucks, announced today the signing of a Letter of Intent (LOI) to integrate Cummins’ X15H hydrogen internal combustion engines into the Terex Advance Commander Series. |
CMI Price Returns
1-mo | -1.63% |
3-mo | -0.67% |
6-mo | 3.69% |
1-year | 13.55% |
3-year | 20.94% |
5-year | 73.78% |
YTD | -3.58% |
2022 | 14.09% |
2021 | -1.68% |
2020 | 30.50% |
2019 | 38.04% |
2018 | -22.06% |
CMI Dividends
Ex-Dividend Date | Type | Payout Amount | Change | ||||||
---|---|---|---|---|---|---|---|---|---|
Loading, please wait... |
Continue Researching CMI
Want to see what other sources are saying about Cummins Inc's financials and stock price? Try the links below:Cummins Inc (CMI) Stock Price | Nasdaq
Cummins Inc (CMI) Stock Quote, History and News - Yahoo Finance
Cummins Inc (CMI) Stock Price and Basic Information | MarketWatch
Loading social stream, please wait...