Costamare Inc. (CMRE): Price and Financial Metrics


Costamare Inc. (CMRE): $9.19

-0.06 (-0.65%)

POWR Rating

Component Grades

Growth

S

Value

I

Momentum

G

Stability

N

Sentiment

U

Quality

P

Add CMRE to Watchlist
Sign Up

Industry: Shipping


Ranked

of

in industry

CMRE POWR Grades

  • CMRE scores best on the Momentum dimension, with a Momentum rank ahead of 84.09% of US stocks.
  • The strongest trend for CMRE is in Growth, which has been heading down over the past 179 days.
  • CMRE's current lowest rank is in the Sentiment metric (where it is better than 23.13% of US stocks).

CMRE Stock Summary

  • With a price/earnings ratio of 2.64, COSTAMARE INC P/E ratio is greater than that of about just 3.09% of stocks in our set with positive earnings.
  • Price to trailing twelve month operating cash flow for CMRE is currently 2.08, higher than only 7.32% of US stocks with positive operating cash flow.
  • For CMRE, its debt to operating expenses ratio is greater than that reported by 94.59% of US equities we're observing.
  • Stocks with similar financial metrics, market capitalization, and price volatility to COSTAMARE INC are GTN, WSR, MPLN, FRT, and HIW.
  • Visit CMRE's SEC page to see the company's official filings. To visit the company's web site, go to www.costamare.com.

CMRE Valuation Summary

  • CMRE's price/sales ratio is 1.1; this is 15.38% lower than that of the median Industrials stock.
  • CMRE's price/earnings ratio has moved down 3.5 over the prior 149 months.

Below are key valuation metrics over time for CMRE.

Stock Date P/S P/B P/E EV/EBIT
CMRE 2023-02-03 1.1 0.6 2.6 5.2
CMRE 2023-02-02 1.1 0.7 2.6 5.3
CMRE 2023-02-01 1.2 0.7 2.7 5.3
CMRE 2023-01-31 1.1 0.6 2.6 5.2
CMRE 2023-01-30 1.1 0.6 2.5 5.2
CMRE 2023-01-27 1.1 0.6 2.6 5.2

CMRE Growth Metrics

    Its 5 year cash and equivalents growth rate is now at 7.52%.
  • Its 4 year net cashflow from operations growth rate is now at 21.75%.
  • The year over year net cashflow from operations growth rate now stands at 97.81%.
Over the past 15 months, CMRE's revenue has gone up $611,805,000.

The table below shows CMRE's growth in key financial areas (numbers in millions of US dollars).

Date Revenue Operating Cash Flow Net Income to Common Stock
2022-09-30 1,132.346 622.609 490.602
2022-06-30 1,059.081 606.72 490.32
2022-03-31 934.924 549.581 458.949
2021-12-31 793.639 466.494 404.053
2021-09-30 628.864 369.494 269.973
2021-06-30 520.541 310.31 180.012

CMRE's Quality Factors

The “Quality” component of the POWR Ratings focuses on 31 different factors of a companies fundamentals and operational strength. Here are some key insights as we drill into the specifics of these quality attributes.
  • CMRE has a Quality Grade of C, ranking ahead of 66.26% of graded US stocks.
  • CMRE's asset turnover comes in at 0.171 -- ranking 108th of 137 Transportation stocks.
  • SINO, OSG, and LPG are the stocks whose asset turnover ratios are most correlated with CMRE.

The table below shows CMRE's key quality metrics over time.

Period Asset Turnover Gross Margin ROIC
2021-09-30 0.171 0.731 0.072
2021-06-30 0.154 0.719 0.058
2021-03-31 0.150 0.713 0.025
2020-12-31 0.154 0.716 0.019
2020-09-30 0.156 0.724 0.022
2020-06-30 0.161 0.738 0.026

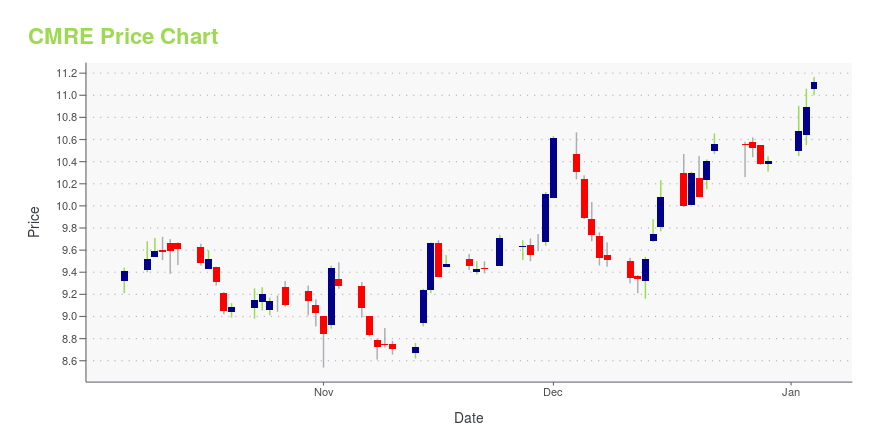
CMRE Stock Price Chart Interactive Chart >

Price chart for CMRE

CMRE Price/Volume Stats

Current price $9.19 52-week high $17.89
Prev. close $9.25 52-week low $8.55
Day low $9.11 Volume 405,200
Day high $9.48 Avg. volume 624,623
50-day MA $9.99 Dividend yield 4.93%
200-day MA $10.32 Market Cap 1.12B

Costamare Inc. (CMRE) Company Bio


Costamare Inc. provides worldwide marine transportation services by chartering its container vessels to the liner operators under long, medium and short-term time charters. The company was founded in 1975 and is based in Athens, Greece.


CMRE Latest News Stream


Event/Time News Detail
Loading, please wait...

CMRE Latest Social Stream


Loading social stream, please wait...

View Full CMRE Social Stream

Latest CMRE News From Around the Web

Below are the latest news stories about COSTAMARE INC that investors may wish to consider to help them evaluate CMRE as an investment opportunity.

Neptune Maritime Leasing Announces Investment From Costamare Inc.

ST HELIER, Jersey, March 16, 2023 (GLOBE NEWSWIRE) -- Neptune Maritime Leasing Limited (“Neptune Leasing” or the “Company”) is pleased to announce that Costamare Inc., (“Costamare”) (NYSE: CMRE), has agreed to become the leading investor in Neptune Leasing through the investment of an amount of up to $200M. Costamare will be appointing three additional members to the Board of Neptune Leasing, including Vassilis Mantzavinos, an experienced shipping banker. Nikoletta Fouska, Chief Investment Offic

Yahoo | March 16, 2023

Costamare Inc. Announces Investment in Neptune Maritime Leasing Limited

MONACO, March 16, 2023 (GLOBE NEWSWIRE) -- Costamare Inc. (“Costamare” or the “Company”) (NYSE: CMRE) has agreed to become the leading investor in Neptune Maritime Leasing Limited (“Neptune Leasing”) through the investment of an amount of up to $200 million. Neptune Leasing is a growth-oriented maritime leasing platform providing flexible financing solutions to shipowners, which was established in 2021 by seasoned financier Harris Antoniou, who will continue as CEO. Mr. Vassilis Mantzavinos, an

Yahoo | March 16, 2023

With 64% ownership, Costamare Inc. (NYSE:CMRE) insiders have a lot riding on the company's future

Key Insights Significant insider control over Costamare implies vested interests in company growth A total of 3...

Yahoo | February 26, 2023

Costamare (CMRE) Misses Q4 Earnings and Revenue Estimates

Costamare (CMRE) delivered earnings and revenue surprises of -12.86% and 1.70%, respectively, for the quarter ended December 2022. Do the numbers hold clues to what lies ahead for the stock?

Yahoo | February 8, 2023

Costamare Inc. Reports Results for the Fourth Quarter and Year Ended December 31, 2022

MONACO, Feb. 08, 2023 (GLOBE NEWSWIRE) -- Costamare Inc. (“Costamare” or the “Company”) (NYSE: CMRE) today reported unaudited financial results for the fourth quarter (“Q4 2022”) and year ended December 31, 2022. I. RECORD PROFITABILITY FOR YEAR ENDED 2022 2022 Net Income available to common stockholders of $523.9 million ($4.26 per share) vs $404.1 million ($3.28 per share) in 2021.2022 Adjusted Net Income available to common stockholders1 of $405.3 million ($3.30 per share) vs $289.9 million (

Yahoo | February 8, 2023

Read More 'CMRE' Stories Here

CMRE Price Returns

1-mo -6.32%
3-mo 2.64%
6-mo -0.43%
1-year -42.20%
3-year 182.16%
5-year 100.60%
YTD 0.21%
2022 -21.34%
2021 59.04%
2020 -7.26%
2019 132.86%
2018 -19.11%

CMRE Dividends

Ex-Dividend Date Type Payout Amount Change
Loading, please wait...
View Full CMRE Dividend History

Get Free Updates

Join thousands of investors who get the latest news, insights and top rated picks from StockNews.com!


Page generated in 0.9466 seconds.