CNA Financial Corp. (CNA): Price and Financial Metrics

CNA Financial Corp. (CNA): $38.72

0.32 (-0.82%)

POWR Rating

Component Grades

Momentum

B

Stability

A

Sentiment

Quality

C

CNA Price/Volume Stats

Current price $38.72 52-week high $45.42
Prev. close $39.04 52-week low $36.17
Day low $38.72 Volume 5,396
Day high $38.96 Avg. volume 198,142
50-day MA $39.80 Dividend yield 4.23%
200-day MA $40.19 Market Cap 10.49B

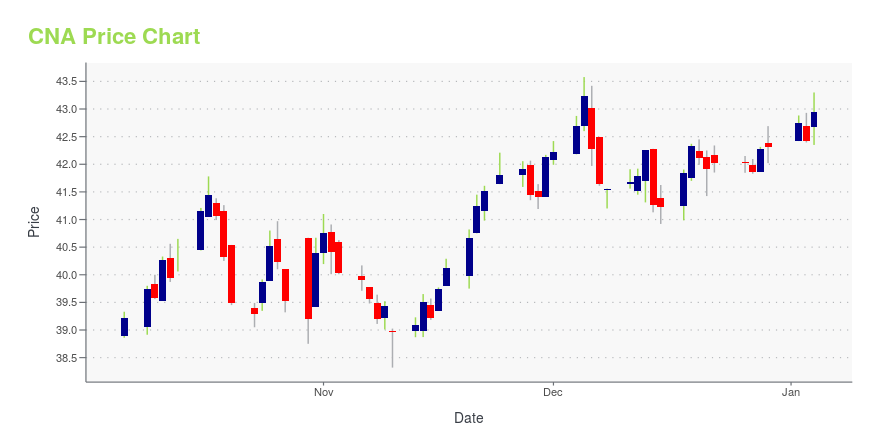
CNA Stock Price Chart Interactive Chart >

CNA POWR Grades

  • Stability is the dimension where CNA ranks best; there it ranks ahead of 95.97% of US stocks.
  • The strongest trend for CNA is in Growth, which has been heading up over the past 177 days.
  • CNA ranks lowest in Quality; there it ranks in the 46th percentile.

CNA Stock Summary

  • CNA FINANCIAL CORP's stock had its IPO on January 1, 1986, making it an older stock than 93.16% of US equities in our set.
  • Of note is the ratio of CNA FINANCIAL CORP's sales and general administrative expense to its total operating expenses; just 0.26% of US stocks have a lower such ratio.
  • In terms of volatility of its share price, CNA is more volatile than merely 7.56% of stocks we're observing.
  • Stocks with similar financial metrics, market capitalization, and price volatility to CNA FINANCIAL CORP are GL, OGE, CPG, FRFHF, and SNDR.
  • Visit CNA's SEC page to see the company's official filings. To visit the company's web site, go to www.cna.com.

CNA Valuation Summary

  • In comparison to the median Financial Services stock, CNA's price/earnings ratio is 16.84% higher, now standing at 11.1.
  • Over the past 243 months, CNA's price/sales ratio has gone up 0.4.

Below are key valuation metrics over time for CNA.

Stock Date P/S P/B P/E EV/EBIT
CNA 2023-09-15 0.8 1.2 11.1 10.3
CNA 2023-09-14 0.9 1.2 11.2 10.3
CNA 2023-09-13 0.8 1.2 11.1 10.3
CNA 2023-09-12 0.8 1.2 11.1 10.3
CNA 2023-09-11 0.8 1.2 10.9 10.2
CNA 2023-09-08 0.8 1.2 10.9 10.1

CNA Growth Metrics

    Its 5 year cash and equivalents growth rate is now at 186.62%.
  • Its 5 year net income to common stockholders growth rate is now at -43.3%.
  • Its 2 year cash and equivalents growth rate is now at -57.88%.
CNA's revenue has moved up $1,700,000,000 over the prior 52 months.

The table below shows CNA's growth in key financial areas (numbers in millions of US dollars).

Date Revenue Operating Cash Flow Net Income to Common Stock
2022-12-31 11,879 2,502 894
2022-09-30 11,822 2,633 912
2022-06-30 11,824 2,565 1,040
2022-03-31 11,927 2,560 1,203
2021-12-31 11,908 1,997 1,202
2021-09-30 11,785 1,721 1,323

CNA's Quality Factors

The “Quality” component of the POWR Ratings focuses on 31 different factors of a companies fundamentals and operational strength. Here are some key insights as we drill into the specifics of these quality attributes.
  • CNA has a Quality Grade of C, ranking ahead of 40.38% of graded US stocks.
  • CNA's asset turnover comes in at 0.181 -- ranking 89th of 133 Insurance stocks.
  • MKL, CINF, and ANAT are the stocks whose asset turnover ratios are most correlated with CNA.

The table below shows CNA's key quality metrics over time.

Period Asset Turnover Gross Margin ROIC
2021-09-30 0.181 0.368 0.026
2021-06-30 0.181 0.365 0.025
2021-03-31 0.180 0.346 0.022
2020-12-31 0.175 0.322 0.015
2020-09-30 0.175 0.314 0.013
2020-06-30 0.174 0.307 0.011

CNA Price Target

For more insight on analysts targets of CNA, see our CNA price target page. And for a list of of all stocks sorted by upside potential based on analyst target price, see our Top Price Target page.

Average Price Target $48.00 Average Broker Recommendation 2 (Hold)

CNA Financial Corp. (CNA) Company Bio


CNA Financial Corporation is a financial corporation based in ChicagoIllinois, United States. Its principal subsidiary, Continental Casualty Company (CCC), was founded in 1897. CNA, the current parent company, was incorporated in 1967. (Source:Wikipedia)


CNA Latest News Stream


Event/Time News Detail
Loading, please wait...

CNA Latest Social Stream


Loading social stream, please wait...

View Full CNA Social Stream

Latest CNA News From Around the Web

Below are the latest news stories about CNA FINANCIAL CORP that investors may wish to consider to help them evaluate CNA as an investment opportunity.

Why This 1 Momentum Stock Could Be a Great Addition to Your Portfolio

The Zacks Style Scores offers investors a way to easily find top-rated stocks based on their investing style. Here's why you should take advantage.

Yahoo | September 27, 2023

Here's Why Hold Strategy is Apt for CNA Financial (CNA) Stock

CNA Financial (CNA) is poised to grow on the back of new businesses, improved non-catastrophe current accident year underwriting results, higher net earned premium and effective capital deployment.

Yahoo | September 25, 2023

Here's Why CNA Financial (CNA) is a Strong Value Stock

Wondering how to pick strong, market-beating stocks for your investment portfolio? Look no further than the Zacks Style Scores.

Yahoo | September 13, 2023

CNA or AFG: Which Property & Casualty Insurer Has an Edge?

Let's see how CNA Financial (CNA) and American Financial (AFG) fare in terms of some of the key metrics.

Yahoo | September 8, 2023

Why Is CNA Financial (CNA) Down 0.1% Since Last Earnings Report?

CNA Financial (CNA) reported earnings 30 days ago. What's next for the stock? We take a look at earnings estimates for some clues.

Yahoo | August 30, 2023

Read More 'CNA' Stories Here

CNA Price Returns

1-mo -2.32%
3-mo 1.19%
6-mo 1.60%
1-year 9.90%
3-year 55.46%
5-year 20.58%
YTD -2.99%
2022 3.82%
2021 19.07%
2020 -5.42%
2019 9.47%
2018 -11.12%

CNA Dividends

Ex-Dividend Date Type Payout Amount Change
Loading, please wait...
View Full CNA Dividend History

Get Free Updates

Join thousands of investors who get the latest news, insights and top rated picks from StockNews.com!