ConnectOne Bancorp, Inc. (CNOB): Price and Financial Metrics

ConnectOne Bancorp, Inc. (CNOB): $18.76

0.14 (-0.74%)

POWR Rating

Component Grades

Momentum

C

Stability

C

Sentiment

Quality

D

Add CNOB to Watchlist
Sign Up

Industry: Northeast Regional Banks

Industry

F

Ranked

#25 of 65

in industry

CNOB Price/Volume Stats

Current price $18.76 52-week high $24.44
Prev. close $18.90 52-week low $13.11
Day low $18.70 Volume 127,500
Day high $19.22 Avg. volume 190,134
50-day MA $21.19 Dividend yield 3.61%
200-day MA $19.32 Market Cap 720.46M

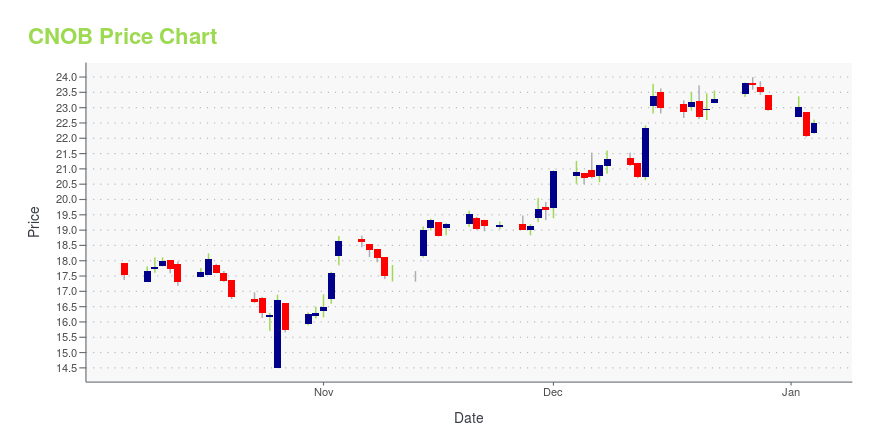
CNOB Stock Price Chart Interactive Chart >

CNOB POWR Grades

  • CNOB scores best on the Stability dimension, with a Stability rank ahead of 70.21% of US stocks.
  • CNOB's strongest trending metric is Growth; it's been moving down over the last 26 weeks.
  • CNOB's current lowest rank is in the Growth metric (where it is better than 4.33% of US stocks).

CNOB Stock Summary

  • CONNECTONE BANCORP INC's capital turnover -- a measure of revenue relative to shareholder's equity -- is better than just 18.67% of US listed stocks.
  • For CNOB, its debt to operating expenses ratio is greater than that reported by 87.54% of US equities we're observing.
  • Equity multiplier, or assets relative to shareholders' equity, comes in at 8.2 for CONNECTONE BANCORP INC; that's greater than it is for 86.35% of US stocks.
  • Stocks with similar financial metrics, market capitalization, and price volatility to CONNECTONE BANCORP INC are SASR, OCFC, MCBS, HOPE, and PPBI.
  • Visit CNOB's SEC page to see the company's official filings. To visit the company's web site, go to www.connectonebank.com.

CNOB Valuation Summary

  • CNOB's price/sales ratio is 3.3; this is 175% higher than that of the median Financial Services stock.
  • CNOB's EV/EBIT ratio has moved down 33.4 over the prior 243 months.

Below are key valuation metrics over time for CNOB.

Stock Date P/S P/B P/E EV/EBIT
CNOB 2023-12-22 3.3 0.8 9.5 11.9
CNOB 2023-12-21 3.2 0.7 9.4 11.8
CNOB 2023-12-20 3.2 0.7 9.3 11.7
CNOB 2023-12-19 3.2 0.8 9.5 11.9
CNOB 2023-12-18 3.2 0.7 9.4 11.8
CNOB 2023-12-15 3.2 0.7 9.4 11.8

CNOB Growth Metrics

    Its 3 year cash and equivalents growth rate is now at 80.55%.
  • Its 4 year revenue growth rate is now at 74.2%.
  • The 3 year net cashflow from operations growth rate now stands at 105.3%.
CNOB's revenue has moved up $106,564,000 over the prior 33 months.

The table below shows CNOB's growth in key financial areas (numbers in millions of US dollars).

Date Revenue Operating Cash Flow Net Income to Common Stock
2022-09-30 292.818 142.575 119.448
2022-06-30 292.496 153.767 124.139
2022-03-31 285.676 167.986 125.509
2021-12-31 284.069 202.273 128.636
2021-09-30 270.459 136.013 122.956
2021-06-30 258.33 125.03 115.645

CNOB's Quality Factors

The “Quality” component of the POWR Ratings focuses on 31 different factors of a companies fundamentals and operational strength. Here are some key insights as we drill into the specifics of these quality attributes.
  • CNOB has a Quality Grade of C, ranking ahead of 37.82% of graded US stocks.
  • CNOB's asset turnover comes in at 0.034 -- ranking 308th of 430 Banking stocks.
  • HWBK, ABCB, and CBAN are the stocks whose asset turnover ratios are most correlated with CNOB.

The table below shows CNOB's key quality metrics over time.

Period Asset Turnover Gross Margin ROIC
2021-06-30 0.034 1 0.020
2021-03-31 0.032 1 0.017
2020-12-31 0.028 1 0.012
2020-09-30 0.028 1 0.011
2020-06-30 0.028 1 0.011
2020-03-31 0.029 1 0.013

CNOB Price Target

For more insight on analysts targets of CNOB, see our CNOB price target page. And for a list of of all stocks sorted by upside potential based on analyst target price, see our Top Price Target page.

Average Price Target $35.40 Average Broker Recommendation 1.3 (Strong Buy)

ConnectOne Bancorp, Inc. (CNOB) Company Bio


ConnectOne Bancorp operates as the bank holding company for ConnectOne Bank that provides various banking products and services in New Jersey. The company was founded in 1982 and is based in Englewood Cliffs, New Jersey.


CNOB Latest News Stream


Event/Time News Detail
Loading, please wait...

CNOB Latest Social Stream


Loading social stream, please wait...

View Full CNOB Social Stream

Latest CNOB News From Around the Web

Below are the latest news stories about CONNECTONE BANCORP INC that investors may wish to consider to help them evaluate CNOB as an investment opportunity.

ConnectOne Bancorp, Inc. (NASDAQ:CNOB) Looks Interesting, And It's About To Pay A Dividend

It looks like ConnectOne Bancorp, Inc. ( NASDAQ:CNOB ) is about to go ex-dividend in the next four days. The...

Yahoo | November 9, 2023

With 70% ownership, ConnectOne Bancorp, Inc. (NASDAQ:CNOB) boasts of strong institutional backing

Key Insights Institutions' substantial holdings in ConnectOne Bancorp implies that they have significant influence over...

Yahoo | November 2, 2023

ConnectOne Bancorp, Inc. (NASDAQ:CNOB) Q3 2023 Earnings Call Transcript

ConnectOne Bancorp, Inc. (NASDAQ:CNOB) Q3 2023 Earnings Call Transcript October 26, 2023 ConnectOne Bancorp, Inc. misses on earnings expectations. Reported EPS is $0.51 EPS, expectations were $0.52. Operator: Hello and welcome to the ConnectOne Bancorp Incorporated Third Quarter 2023 Earnings Conference Call. All lines have been placed on mute to prevent any background noise. After […]

Yahoo | October 27, 2023

Compared to Estimates, ConnectOne (CNOB) Q3 Earnings: A Look at Key Metrics

While the top- and bottom-line numbers for ConnectOne (CNOB) give a sense of how the business performed in the quarter ended September 2023, it could be worth looking at how some of its key metrics compare to Wall Street estimates and year-ago values.

Yahoo | October 26, 2023

ConnectOne Bancorp Inc (CNOB) Reports Q3 2023 Earnings and Declares Dividends

Net income remains steady, dividends declared for common and preferred stockholders

Yahoo | October 26, 2023

Read More 'CNOB' Stories Here

CNOB Price Returns

1-mo -8.40%
3-mo -16.56%
6-mo 8.15%
1-year 8.79%
3-year -23.27%
5-year 6.21%
YTD -17.40%
2023 -1.84%
2022 -24.35%
2021 67.84%
2020 -21.39%
2019 41.53%

CNOB Dividends

Ex-Dividend Date Type Payout Amount Change
Loading, please wait...
View Full CNOB Dividend History

Get Free Updates

Join thousands of investors who get the latest news, insights and top rated picks from StockNews.com!