Capital One Financial Corp. (COF): Price and Financial Metrics
COF Price/Volume Stats
Current price | $148.89 | 52-week high | $149.27 |
Prev. close | $144.51 | 52-week low | $83.93 |
Day low | $145.00 | Volume | 4,039,400 |
Day high | $149.27 | Avg. volume | 2,804,438 |
50-day MA | $136.61 | Dividend yield | 1.7% |
200-day MA | $116.06 | Market Cap | 56.64B |
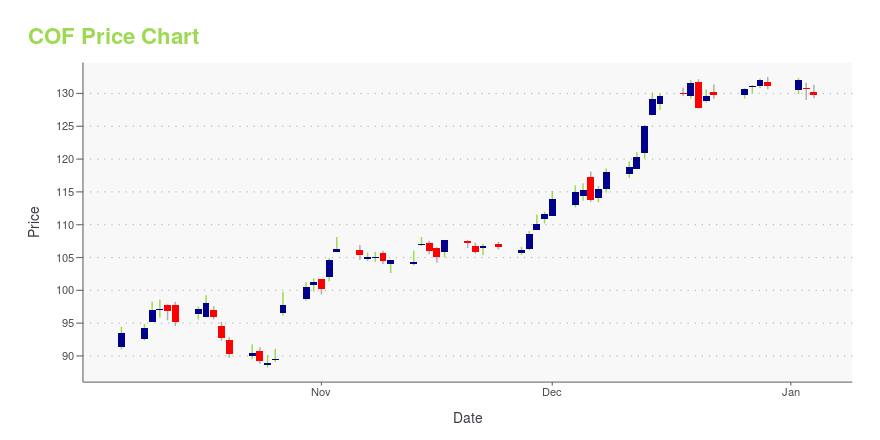
COF Stock Price Chart Interactive Chart >
COF POWR Grades
- Momentum is the dimension where COF ranks best; there it ranks ahead of 93.11% of US stocks.
- COF's strongest trending metric is Growth; it's been moving up over the last 26 weeks.
- COF ranks lowest in Growth; there it ranks in the 18th percentile.
COF Stock Summary
- COF has a higher market value than 95.01% of US stocks; more precisely, its current market capitalization is $49,784,289,905.
- The price/operating cash flow metric for CAPITAL ONE FINANCIAL CORP is higher than only 6.8% of stocks in our set with a positive cash flow.
- Shareholder yield, a measure of how much is returned to shareholders via dividends and share repurchases, for COF comes in at 13.64% -- higher than that of 87.61% of stocks in our set.
- If you're looking for stocks that are quantitatively similar to CAPITAL ONE FINANCIAL CORP, a group of peers worth examining would be AFL, AIG, ROK, GIS, and EMR.
- Visit COF's SEC page to see the company's official filings. To visit the company's web site, go to www.capitalone.com.
COF Valuation Summary
- In comparison to the median Financial Services stock, COF's price/sales ratio is 58.33% higher, now standing at 1.9.
- COF's price/sales ratio has moved down 0.3 over the prior 243 months.
Below are key valuation metrics over time for COF.
Stock | Date | P/S | P/B | P/E | EV/EBIT |
---|---|---|---|---|---|
COF | 2023-12-22 | 1.9 | 0.9 | 9.7 | 8.1 |
COF | 2023-12-21 | 1.9 | 0.9 | 9.7 | 8.1 |
COF | 2023-12-20 | 1.8 | 0.9 | 9.5 | 8.0 |
COF | 2023-12-19 | 1.9 | 0.9 | 9.8 | 8.2 |
COF | 2023-12-18 | 1.9 | 0.9 | 9.7 | 8.1 |
COF | 2023-12-15 | 1.9 | 0.9 | 9.7 | 8.1 |
COF Growth Metrics
- Its 5 year revenue growth rate is now at -0.52%.
- The 4 year cash and equivalents growth rate now stands at 167.7%.
- Its 3 year revenue growth rate is now at 42.74%.
The table below shows COF's growth in key financial areas (numbers in millions of US dollars).
Date | Revenue | Operating Cash Flow | Net Income to Common Stock |
---|---|---|---|
2022-12-31 | 28,403 | 13,809 | 7,044 |
2022-09-30 | 29,516 | 10,314 | 8,179 |
2022-06-30 | 30,552 | 9,491 | 9,550 |
2022-03-31 | 31,939 | 10,595 | 11,047 |
2021-12-31 | 32,379 | 12,310 | 11,965 |
2021-09-30 | 31,715 | 12,275 | 12,135 |
COF's Quality Factors
The “Quality” component of the POWR Ratings focuses on 31 different factors of a companies fundamentals and operational strength. Here are some key insights as we drill into the specifics of these quality attributes.- COF has a Quality Grade of C, ranking ahead of 43.19% of graded US stocks.
- COF's asset turnover comes in at 0.072 -- ranking 61st of 428 Banking stocks.
- SASR, AXP, and SMBC are the stocks whose asset turnover ratios are most correlated with COF.
The table below shows COF's key quality metrics over time.
Period | Asset Turnover | Gross Margin | ROIC |
---|---|---|---|
2021-06-30 | 0.072 | 1 | 0.038 |
2021-03-31 | 0.058 | 1 | 0.023 |
2020-12-31 | 0.044 | 1 | 0.008 |
2020-09-30 | 0.041 | 1 | 0.004 |
2020-06-30 | 0.039 | 1 | -0.001 |
2020-03-31 | 0.049 | 1 | 0.008 |
COF Price Target
For more insight on analysts targets of COF, see our COF price target page. And for a list of of all stocks sorted by upside potential based on analyst target price, see our Top Price Target page.
Average Price Target | $182.85 | Average Broker Recommendation | 1.54 (Moderate Buy) |
Capital One Financial Corp. (COF) Company Bio
Capital One Financial Corporation is an American bank holding company specializing in credit cards, auto loans, banking, and savings accounts, headquartered in McLean, Virginia with operations primarily in the United States. It is on the list of largest banks in the United States and has developed a reputation for being a technology-focused bank. (Source:Wikipedia)
Latest COF News From Around the Web
Below are the latest news stories about CAPITAL ONE FINANCIAL CORP that investors may wish to consider to help them evaluate COF as an investment opportunity.
15 Best Dividend Stocks to Buy According to Warren BuffettIn this piece, we will take a look at the 15 best dividend stocks to buy according to Warren Buffett. If you want to skip our overview of the dividend stocks and the latest news, then you can take a look at the 5 Best Dividend Stocks to Buy According to Warren Buffett. The US Federal […] |
13 Most Promising Fintech Stocks To BuyIn this piece, we will take a look at the 13 most promising fintech stocks to buy. If you want to skip our detailed analysis of the financial technology industry, then you can skip ahead to 5 Most Promising Fintech Stocks To Buy. The finance industry is one of the largest in the world. Banks […] |
What's in Your Wallet as Capital One Makes an Upside Breakout?Shares of Capital One Financial have rallied sharply since late October and broken out over the highs of July and February. Will the stock keep going up or is this a "false breakout"? In the daily bar chart of COF, below, I can see a broad-trading sideways market for much of the past year. |
Strength Seen in Capital One (COF): Can Its 3.3% Jump Turn into More Strength?Capital One (COF) witnessed a jump in share price last session on above-average trading volume. The latest trend in earnings estimate revisions for the stock doesn't suggest further strength down the road. |
Capital One continues to top JPMorgan, TD in big-bank satisfaction surveyCapital One holds its spot for a fourth straight year, while Wells Fargo and Truist have secured the bottom two positions, two years in a row, respectively. |
COF Price Returns
1-mo | 8.19% |
3-mo | 14.06% |
6-mo | 54.99% |
1-year | 61.67% |
3-year | 23.85% |
5-year | 100.77% |
YTD | 14.06% |
2023 | 44.32% |
2022 | -34.25% |
2021 | 49.32% |
2020 | -2.66% |
2019 | 38.62% |
COF Dividends
Ex-Dividend Date | Type | Payout Amount | Change | ||||||
---|---|---|---|---|---|---|---|---|---|
Loading, please wait... |
Loading social stream, please wait...