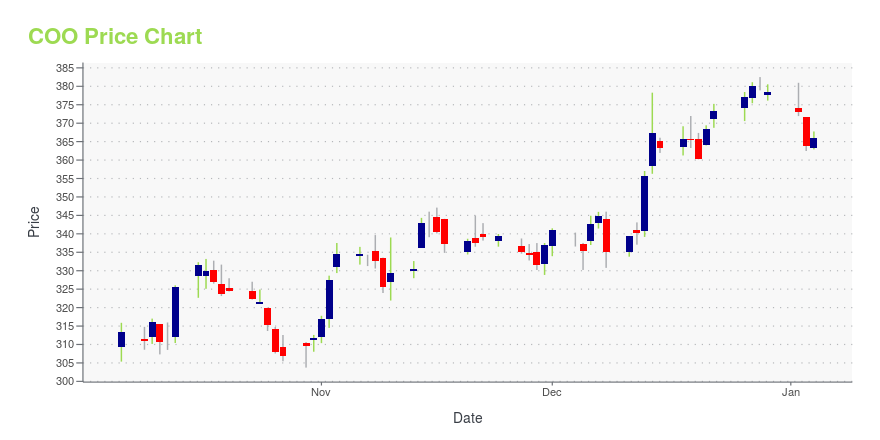
Cooper Cos. (COO): Price and Financial Metrics
COO Price/Volume Stats
| Current price | $93.21 | 52-week high | $104.07 |
| Prev. close | $92.68 | 52-week low | $75.93 |
| Day low | $92.41 | Volume | 1,063,395 |
| Day high | $94.17 | Avg. volume | 1,130,185 |
| 50-day MA | $91.73 | Dividend yield | N/A |
| 200-day MA | $91.46 | Market Cap | 18.56B |
COO Stock Price Chart Interactive Chart >
Cooper Cos. (COO) Company Bio
The Cooper Companies, Inc., branded as CooperCompanies, is a global medical device company, publicly traded on the NYSE (NYSE:COO). With its headquarters in San Ramon, California, it has a workforce of more than 12,000 employees and consists of two business units, CooperVision (CVI) which manufactures contact lenses, and CooperSurgical (CSI) which manufactures medical devices and fertility and genomic products for the women’s health care market. (Source:Wikipedia)
Latest COO News From Around the Web
Below are the latest news stories about COOPER COMPANIES INC that investors may wish to consider to help them evaluate COO as an investment opportunity.
CooperCompanies to Present at the J.P. Morgan Healthcare ConferenceSAN RAMON, Calif., Dec. 21, 2023 (GLOBE NEWSWIRE) -- CooperCompanies (Nasdaq: COO), a leading global medical device company, will participate at the J.P. Morgan Healthcare Conference on Tuesday, January 9, 2024. Al White, President and CEO, will represent the Company in a session scheduled to begin at 6:00 PM ET. The webcast will be available to investors and other interested parties by accessing the CooperCompanies’ website at http://investor.coopercos.com. A replay of the event will be availab |
CooperCompanies Sets Annual Meeting And Stockholder Record DatesSAN RAMON, Calif., Dec. 19, 2023 (GLOBE NEWSWIRE) -- Cooper Companies (Nasdaq: COO) announced today that it will hold its next annual meeting of stockholders on Tuesday, March 19, 2024. Stockholders of record as of the close of business on January 24, 2024, will be eligible to vote on matters presented in the Company's proxy statement, including electing its slate of directors. About CooperCompanies CooperCompanies (Nasdaq: COO) is a leading global medical device company focused on improving liv |
Cooper Companies' (NASDAQ:COO) investors will be pleased with their decent 37% return over the last five yearsThe main point of investing for the long term is to make money. Furthermore, you'd generally like to see the share... |
Decoding The Cooper Companies Inc (COO): A Strategic SWOT InsightInsightful Analysis of The Cooper Companies Inc's Market Position and Future Prospects |
The Cooper Companies, Inc. (COO) Q4 2023 Earnings Call TranscriptThe Cooper Companies, Inc. (COO) Q4 2023 Earnings Conference Call December 07, 2023, 17:00 PM ET Company Participants Kim Duncan - VP of IR & Risk Management Albert White - President and CEO Brian Andrews - CFO & Treasurer Conference Call Participants Jason Bednar - Piper Sandler Lawrence Biegelsen - Wells Fargo Jeffrey Johnson - Baird Jonathan Block - Stifel Craig Bijou - Bank of America Robbie Marcus - JPMorgan Steven Lichtman - Oppenheimer David Saxon - Needham Navann Ty - BNP Paribas Anthony Petrone - Mizuho Presentation Operator Thank you for standing by and welcome to the Q4 2023 Coope... |
COO Price Returns
| 1-mo | 5.97% |
| 3-mo | 4.92% |
| 6-mo | 0.05% |
| 1-year | -4.07% |
| 3-year | -9.03% |
| 5-year | 10.39% |
| YTD | -1.48% |
| 2023 | 14.47% |
| 2022 | -21.06% |
| 2021 | 15.33% |
| 2020 | 13.10% |
| 2019 | 26.27% |
Continue Researching COO
Want to see what other sources are saying about Cooper Companies Inc's financials and stock price? Try the links below:Cooper Companies Inc (COO) Stock Price | Nasdaq
Cooper Companies Inc (COO) Stock Quote, History and News - Yahoo Finance
Cooper Companies Inc (COO) Stock Price and Basic Information | MarketWatch


Loading social stream, please wait...