
Cooper-Standard Holdings Inc. (CPS): Price and Financial Metrics
CPS Price/Volume Stats
| Current price | $13.92 | 52-week high | $22.74 |
| Prev. close | $13.74 | 52-week low | $11.24 |
| Day low | $13.54 | Volume | 54,736 |
| Day high | $14.25 | Avg. volume | 140,599 |
| 50-day MA | $13.02 | Dividend yield | N/A |
| 200-day MA | $15.34 | Market Cap | 240.68M |
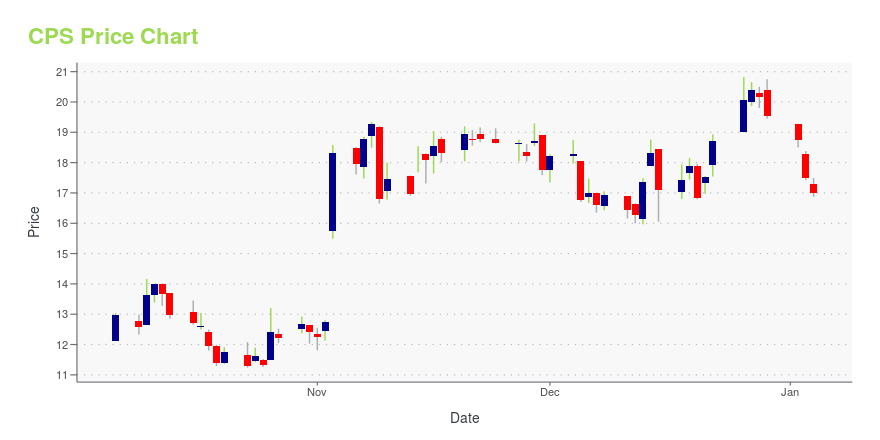
CPS Stock Price Chart Interactive Chart >
Cooper-Standard Holdings Inc. (CPS) Company Bio
Cooper-Standard Holdings is a leading global supplier of systems and components for the automotive industry. Products include sealing, fuel and brake delivery, fluid transfer and anti-vibration systems. The company was founded in 1960 and is based in Novi, Michigan.
Latest CPS News From Around the Web
Below are the latest news stories about COOPER-STANDARD HOLDINGS INC that investors may wish to consider to help them evaluate CPS as an investment opportunity.
Cooper Standard Named to Newsweek's America's Most Responsible Companies 2024 ListFor the fifth consecutive year, Cooper Standard (NYSE: CPS) has been named to Newsweek's list of America's Most Responsible Companies 2024. The rankings are conducted by Newsweek and Statista Inc., the world-leading statistics portal and industry ranking provider. |
Cooper-Standard Holdings' (NYSE:CPS) investors will be pleased with their splendid 181% return over the last yearUnfortunately, investing is risky - companies can and do go bankrupt. But if you pick the right business to buy shares... |
Cooper Standard's Venkat Receives ORBIE® Award by MichiganCIOCooper Standard's (NYSE: CPS) Soma Venkat, Ph.D., senior vice president and CIO, has been honored with a 2023 Michigan ORBIE® Award. MichiganCIO recognized technology executives in eight ORBIE Award categories – Leadership, Super Global, Global, Large Enterprise, Enterprise, Large Corporate, Corporate, and Nonprofit/Public Sector. The awards were presented at the Michigan ORBIE Awards at The Henry in Dearborn, Michigan. |
Cooper Standard FlushSeal™ System Named SPE® Automotive Innovation Award FinalistCooper Standard (NYSE: CPS) has been recognized as a 2023 Society of Plastics Engineers (SPE) Automotive Innovation Award finalist for its FlushSeal™ System found on several NIO models. The innovation, which is recognized in the Body Exterior category, is one of 28 technologies named a finalist in the annual program that honors the best companies in automotive plastics. |
Cooper-Standard Holdings Inc. (NYSE:CPS) Q3 2023 Earnings Call TranscriptCooper-Standard Holdings Inc. (NYSE:CPS) Q3 2023 Earnings Call Transcript November 3, 2023 Operator: Good morning, ladies and gentlemen, and welcome to the Cooper-Standard Third Quarter 2023 Earnings Conference Call. [Operator Instructions] As a reminder, this conference call is being recorded, and the webcast will be available on the Cooper-Standard website for replay later today. I […] |
CPS Price Returns
| 1-mo | 17.67% |
| 3-mo | -13.00% |
| 6-mo | -17.09% |
| 1-year | -18.93% |
| 3-year | -42.88% |
| 5-year | -72.14% |
| YTD | -28.76% |
| 2023 | 115.67% |
| 2022 | -59.57% |
| 2021 | -35.36% |
| 2020 | 4.55% |
| 2019 | -46.62% |
Loading social stream, please wait...