Caesarstone Ltd. - Ordinary Shares (CSTE): Price and Financial Metrics


Caesarstone Ltd. - Ordinary Shares (CSTE): $4.25

0.03 (+0.71%)

POWR Rating

Component Grades

Growth

S

Value

I

Momentum

G

Stability

N

Sentiment

U

Quality

P

CSTE POWR Grades

  • CSTE scores best on the Value dimension, with a Value rank ahead of 82.43% of US stocks.
  • CSTE's strongest trending metric is Value; it's been moving up over the last 178 days.
  • CSTE ranks lowest in Growth; there it ranks in the 3rd percentile.

CSTE Stock Summary

  • CSTE's one year PEG ratio, measuring expected growth in earnings next year relative to current common stock price is 0.83 -- higher than merely 15.83% of US-listed equities with positive expected earnings growth.
  • CSTE's price/sales ratio is 0.21; that's higher than the P/S ratio of merely 6.64% of US stocks.
  • Over the past twelve months, CSTE has reported earnings growth of -308.29%, putting it ahead of just 5.08% of US stocks in our set.
  • Stocks with similar financial metrics, market capitalization, and price volatility to CAESARSTONE LTD are NHC, MRTN, AMED, MCY, and BH.
  • Visit CSTE's SEC page to see the company's official filings. To visit the company's web site, go to www.caesarstone.com.

CSTE Valuation Summary

  • CSTE's price/sales ratio is 0.2; this is 83.33% lower than that of the median Basic Materials stock.
  • Over the past 134 months, CSTE's price/earnings ratio has gone down 20.

Below are key valuation metrics over time for CSTE.

Stock Date P/S P/B P/E EV/EBIT
CSTE 2023-03-16 0.2 0.4 -2.6 -4.3
CSTE 2023-03-15 0.2 0.4 -2.7 -4.3
CSTE 2023-03-14 0.2 0.4 -2.9 -4.5
CSTE 2023-03-13 0.2 0.4 -2.9 -4.5
CSTE 2023-03-10 0.2 0.4 -3.0 -4.6
CSTE 2023-03-09 0.2 0.4 -3.0 -4.6

CSTE Growth Metrics

    The 5 year cash and equivalents growth rate now stands at 8.97%.
  • Its year over year net cashflow from operations growth rate is now at -110.22%.
  • Its 2 year net income to common stockholders growth rate is now at -30.99%.
Over the past 33 months, CSTE's revenue has gone up $156,520,000.

The table below shows CSTE's growth in key financial areas (numbers in millions of US dollars).

Date Revenue Operating Cash Flow Net Income to Common Stock
2022-09-30 702.494 -25.053 14.035
2022-06-30 685.108 -30.155 20.446
2022-03-31 668.298 -4.738 11.004
2021-12-31 643.892 20.684 18.966
2021-12-31 643.892 20.972 18.966
2021-09-30 609.731 35.778 19.458

CSTE's Quality Factors

The “Quality” component of the POWR Ratings focuses on 31 different factors of a companies fundamentals and operational strength. Here are some key insights as we drill into the specifics of these quality attributes.
  • CSTE has a Quality Grade of C, ranking ahead of 59.61% of graded US stocks.
  • CSTE's asset turnover comes in at 0.739 -- ranking 37th of 60 Construction Materials stocks.
  • PATK, SNA, and DOOR are the stocks whose asset turnover ratios are most correlated with CSTE.

The table below shows CSTE's key quality metrics over time.

Period Asset Turnover Gross Margin ROIC
2021-09-30 0.739 0.279 0.061
2021-06-30 0.720 0.292 0.075
2021-03-31 0.668 0.278 0.065
2020-12-31 0.666 0.275 0.041
2020-12-31 0.666 0.275 0.022
2020-09-30 0.689 0.270 0.030

CSTE Price Target

For more insight on analysts targets of CSTE, see our CSTE price target page. And for a list of of all stocks sorted by upside potential based on analyst target price, see our Top Price Target page.

Average Price Target $19.50 Average Broker Recommendation 1.75 (Moderate Buy)

CSTE Stock Price Chart Interactive Chart >

Price chart for CSTE

CSTE Price/Volume Stats
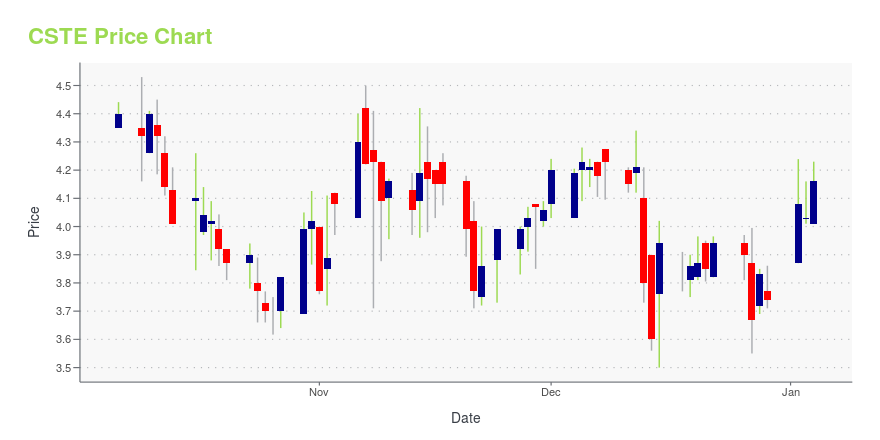
Current price $4.25 52-week high $11.59
Prev. close $4.22 52-week low $4.16
Day low $4.16 Volume 91,500
Day high $4.36 Avg. volume 113,872
50-day MA $5.74 Dividend yield 4.55%
200-day MA $7.91 Market Cap 146.65M

Caesarstone Ltd. - Ordinary Shares (CSTE) Company Bio


CaesarStone Sdot-Yam Ltd. manufactures high quality engineered quartz surfaces, which are used in both residential and commercial buildings as countertops, vanities, wall cladding, floors and other interior surfaces. The company was founded in 1987 and is based in MP Menashe, Israel.


CSTE Latest News Stream


Event/Time News Detail
Loading, please wait...

CSTE Latest Social Stream


Loading social stream, please wait...

View Full CSTE Social Stream

Latest CSTE News From Around the Web

Below are the latest news stories about CAESARSTONE LTD that investors may wish to consider to help them evaluate CSTE as an investment opportunity.

Caesarstone Names Yosef (Yos) Shiran as new Chief Executive Officer Effective March 16, 2023

MP MENASHE, Israel, March 09, 2023--Caesarstone Ltd. (NASDAQ: CSTE), a leading developer and manufacturer of high-quality engineered surfaces, today announced that Yosef (Yos) Shiran has been appointed as its Chief Executive Officer. Shiran, who previously served as Caesarstone’s Chief Executive Officer from 2009 to 2016, will reassume the role on March 16, 2023. Following Shiran’s appointment, Yuval Dagim, the current Chief Executive Officer, will step down and assist in ensuring business conti

Yahoo | March 9, 2023

Caesarstone Ltd. (NASDAQ:CSTE) Q4 2022 Earnings Call Transcript

Caesarstone Ltd. (NASDAQ:CSTE) Q4 2022 Earnings Call Transcript March 1, 2023 Operator: Greetings, and welcome to the Caesarstone Limited Fourth Quarter 2022 Earnings Conference Call. At this time, all participants are in a listen-only mode. A brief question-and-answer session will follow the formal presentation. As a reminder, this conference is being recorded. It is now […]

Yahoo | March 3, 2023

Caesarstone Full Year 2022 Earnings: US$1.65 loss per share (vs US$0.51 profit in FY 2021)

Caesarstone ( NASDAQ:CSTE ) Full Year 2022 Results Key Financial Results Revenue: US$690.8m (up 7.3% from FY 2021). Net...

Yahoo | March 2, 2023

CaesarStone (CSTE) Reports Q4 Loss, Lags Revenue Estimates

CaesarStone (CSTE) delivered earnings and revenue surprises of -200% and 4.47%, respectively, for the quarter ended December 2022. Do the numbers hold clues to what lies ahead for the stock?

Yahoo | March 1, 2023

Caesarstone Reports Fourth Quarter and Full Year 2022 Financial Results

MP MENASHE, Israel, March 01, 2023--Caesarstone Ltd. (NASDAQ: CSTE), a leading developer and manufacturer of high-quality engineered surfaces, today reported financial results for its fourth quarter and full year ended December 31, 2022.

Yahoo | March 1, 2023

Read More 'CSTE' Stories Here

CSTE Price Returns

1-mo -29.98%
3-mo -25.96%
6-mo -53.40%
1-year -61.70%
3-year -49.90%
5-year -75.93%
YTD -25.57%
2022 -48.68%
2021 -10.27%
2020 -13.66%
2019 11.81%
2018 -37.16%

CSTE Dividends

Ex-Dividend Date Type Payout Amount Change
Loading, please wait...
View Full CSTE Dividend History

Continue Researching CSTE

Want to see what other sources are saying about Caesarstone Ltd's financials and stock price? Try the links below:

Caesarstone Ltd (CSTE) Stock Price | Nasdaq
Caesarstone Ltd (CSTE) Stock Quote, History and News - Yahoo Finance
Caesarstone Ltd (CSTE) Stock Price and Basic Information | MarketWatch

Get Free Updates

Join thousands of investors who get the latest news, insights and top rated picks from StockNews.com!


Page generated in 0.8504 seconds.