
CSW Industrials, Inc. (CSWI): Price and Financial Metrics
CSWI Price/Volume Stats
| Current price | $300.87 | 52-week high | $301.36 |
| Prev. close | $291.71 | 52-week low | $167.21 |
| Day low | $295.62 | Volume | 105,714 |
| Day high | $301.00 | Avg. volume | 97,599 |
| 50-day MA | $267.37 | Dividend yield | 0.28% |
| 200-day MA | $224.83 | Market Cap | 4.67B |
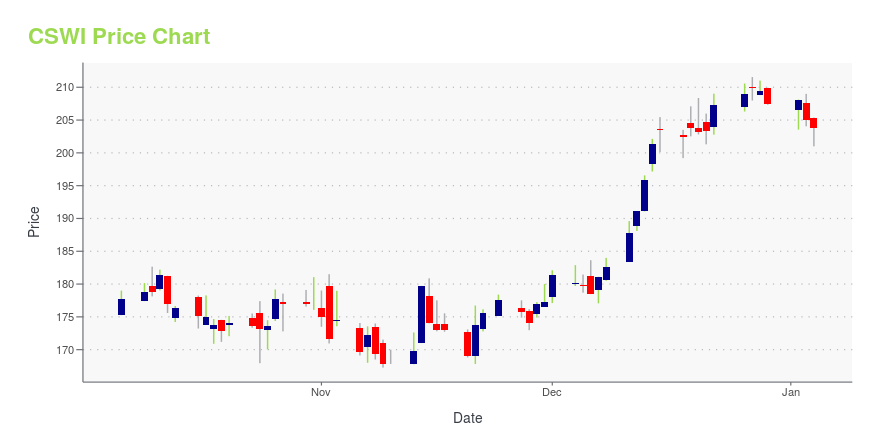
CSWI Stock Price Chart Interactive Chart >
CSW Industrials, Inc. (CSWI) Company Bio
CSW Industrials Inc. manufactures and sells industrial products, coatings, sealants and adhesives, and specialty chemicals in the United States and internationally. The company was founded in 2014 and is based in Dallas, Texas.
Latest CSWI News From Around the Web
Below are the latest news stories about CSW INDUSTRIALS INC that investors may wish to consider to help them evaluate CSWI as an investment opportunity.
Sidoti Events, LLC's Virtual December Small-Cap ConferenceNEW YORK, NY / ACCESSWIRE / December 5, 2023 / Sidoti Events, LLC, an affiliate of Sidoti & Company, LLC, has released the presentation schedule and weblinks for its two-day December Small-Cap Conference taking place Wednesday and Thursday, December ... |
Tejon Ranch Co. and Majestic Realty Co. Joint Venture Announces New Lease and Tenant at the Tejon Ranch Commerce Center (TRCC)RectorSeal, a leading manufacturer and distributor of industrial components, relocates from the Los Angeles basin to join the growing list of companies moving distribution operations to TRCCTEJON RANCH, Calif., Dec. 04, 2023 (GLOBE NEWSWIRE) -- The partnership of Tejon Ranch Co. (NYSE: TRC) and Majestic Realty Co. today announced it has secured a lease, several months in advance of occupancy, with RectorSeal, LLC. RectorSeal is a leading manufacturer of quality HVAC/R and plumbing products distr |
Tech Titans Rising: 7 Underrated Stocks Set for Explosive GrowthWhile Wall Street keeps a watchful eye on the giants, there are lesser-known stocks quietly charting a course for explosive growth. |
Could The Market Be Wrong About CSW Industrials, Inc. (NASDAQ:CSWI) Given Its Attractive Financial Prospects?It is hard to get excited after looking at CSW Industrials' (NASDAQ:CSWI) recent performance, when its stock has... |
CSW Industrials Reports Fiscal 2024 Second Quarter and First Half Results with Record Revenue, EPS and EBITDA in Each Reporting PeriodDALLAS, Nov. 02, 2023 (GLOBE NEWSWIRE) -- CSW Industrials, Inc. (Nasdaq: CSWI or the "Company") today reported record results for the fiscal 2024 second quarter and first half periods ended September 30, 2023. Fiscal 2024 Second Quarter Highlights (comparisons to fiscal 2023 second quarter) Total revenue increased 7% to a record $203.7 million, of which 5%, or $10.1 million was organic growth, and 1% or $2.4 million was inorganic revenue from acquisitions within the last twelve monthsNet income |
CSWI Price Returns
| 1-mo | 13.60% |
| 3-mo | 25.98% |
| 6-mo | 47.20% |
| 1-year | 70.74% |
| 3-year | 166.72% |
| 5-year | 339.38% |
| YTD | 45.43% |
| 2023 | 79.79% |
| 2022 | -3.52% |
| 2021 | 8.50% |
| 2020 | 46.39% |
| 2019 | 60.23% |
CSWI Dividends
| Ex-Dividend Date | Type | Payout Amount | Change | ||||||
|---|---|---|---|---|---|---|---|---|---|
| Loading, please wait... | |||||||||
Continue Researching CSWI
Want to do more research on Csw Industrials Inc's stock and its price? Try the links below:Csw Industrials Inc (CSWI) Stock Price | Nasdaq
Csw Industrials Inc (CSWI) Stock Quote, History and News - Yahoo Finance
Csw Industrials Inc (CSWI) Stock Price and Basic Information | MarketWatch
Loading social stream, please wait...