
Coterra Energy Inc. (CTRA): Price and Financial Metrics
CTRA Price/Volume Stats
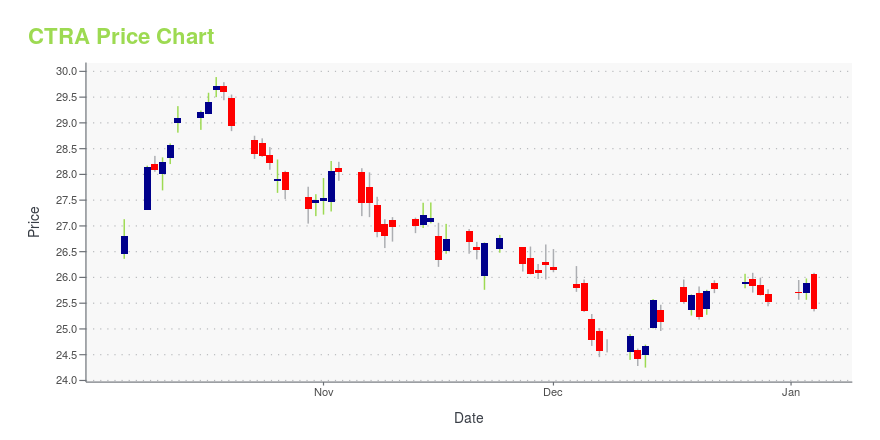
| Current price | $25.78 | 52-week high | $29.89 |
| Prev. close | $25.72 | 52-week low | $23.73 |
| Day low | $25.48 | Volume | 4,015,300 |
| Day high | $25.89 | Avg. volume | 6,425,686 |
| 50-day MA | $27.16 | Dividend yield | 3.21% |
| 200-day MA | $26.72 | Market Cap | 19.19B |
CTRA Stock Price Chart Interactive Chart >
Coterra Energy Inc. (CTRA) Company Bio
Coterra Energy Inc., an independent oil and gas company, explores for, exploits, develops, produces, and markets oil and gas properties in the United States. It primarily focuses on the Marcellus Shale with approximately 175,000 net acres in the dry gas window of the play located in Susquehanna County, Pennsylvania. The company sells its natural gas to industrial customers, local distribution companies, gas marketers, and power generation facilities through gathering systems and pipelines. As of December 31, 2020, it had proved reserves of approximately 13,672 billion cubic feet of gas; and 15 thousand barrels of oil or other liquid hydrocarbons. Coterra Energy Inc. was incorporated in 1989 and is headquartered in Houston, Texas.
Latest CTRA News From Around the Web
Below are the latest news stories about COTERRA ENERGY INC that investors may wish to consider to help them evaluate CTRA as an investment opportunity.
Does The Energy Sector Have The Energy To Offer Good Investments?While some companies have struggled in recent years, there are opportunities for growth and attractive valuations. |
Those who invested in Coterra Energy (NYSE:CTRA) three years ago are up 89%By buying an index fund, you can roughly match the market return with ease. But if you choose individual stocks with... |
6 intriguing stocks investors should consider: Piper SandlerThe market has slightly rebounded, with some investors excited for a possible Santa Claus rally to close out the year. Piper Sandler's technical research team announced six stocks that are currently looking attractive for investor portfolios: Amazon (AMZN), Amgen Inc. (AMGN), Coterra Energy (CTRA), Lululemon (LULU), Assurant (AIZ), and Palo Alto Networks (PANW). Jason Glazer, Piper Sandler & Co. Managing Director and Head of Product Management, joins Yahoo Finance to break down the company's picks, how they arrived there, and give insight into the chosen stocks. "[Lululemon] stands out because it has both high earnings growth and earnings expectations and if you go into the business they have pretty high margins with about 45% of sales coming from company-owned sales and 45% of sales co... |
Coterra Energy Inc (CTRA) Posts $323 Million Net Income in Q3 2023, Announces Quarterly DividendCTRA's Q3 2023 results show strong financial performance with a net income of $323 million and a quarterly dividend of $0.20 per share |
Coterra Energy Reports Third-Quarter 2023 Results, Announces Quarterly DividendHOUSTON, November 06, 2023--Coterra Energy Inc. (NYSE: CTRA) ("Coterra" or the "Company") today reported third-quarter 2023 financial and operating results. Additionally, the Company declared a quarterly dividend of $0.20 per share, provided fourth-quarter production and capital guidance, and updated full-year 2023 guidance. |
CTRA Price Returns
| 1-mo | -3.99% |
| 3-mo | -8.19% |
| 6-mo | 4.47% |
| 1-year | -3.08% |
| 3-year | 97.64% |
| 5-year | 71.43% |
| YTD | 2.59% |
| 2023 | 8.72% |
| 2022 | 41.43% |
| 2021 | 23.50% |
| 2020 | -4.33% |
| 2019 | -20.78% |
CTRA Dividends
| Ex-Dividend Date | Type | Payout Amount | Change | ||||||
|---|---|---|---|---|---|---|---|---|---|
| Loading, please wait... | |||||||||
Continue Researching CTRA
Want to see what other sources are saying about Contura Energy Inc's financials and stock price? Try the links below:Contura Energy Inc (CTRA) Stock Price | Nasdaq
Contura Energy Inc (CTRA) Stock Quote, History and News - Yahoo Finance
Contura Energy Inc (CTRA) Stock Price and Basic Information | MarketWatch
Loading social stream, please wait...