
CubeSmart Common Shares (CUBE): Price and Financial Metrics
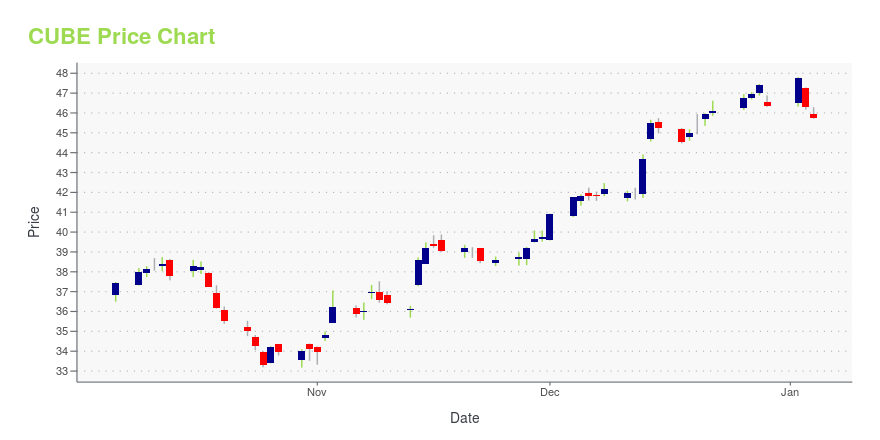
CUBE Price/Volume Stats
| Current price | $47.64 | 52-week high | $49.58 |
| Prev. close | $47.01 | 52-week low | $33.17 |
| Day low | $47.05 | Volume | 1,357,144 |
| Day high | $48.06 | Avg. volume | 1,373,527 |
| 50-day MA | $44.61 | Dividend yield | 4.21% |
| 200-day MA | $42.78 | Market Cap | 10.72B |
CUBE Stock Price Chart Interactive Chart >
CubeSmart Common Shares (CUBE) Company Bio
CubeSmart engages in ownership, operation, acquisition and development of self-storage facilities. The company was founded in July 2004 and is based in Malvern, Pennsylvania.
Latest CUBE News From Around the Web
Below are the latest news stories about CUBESMART that investors may wish to consider to help them evaluate CUBE as an investment opportunity.
Early Retirement Portfolio: 16 Stocks to Live Off Dividends RevisitedIn this article, we discuss the best dividend stocks for an early retirement portfolio. You can skip our detailed analysis of dividend stocks and their performance in the past, and go directly to read Early Retirement Portfolio: 5 Stocks to Live Off Dividends Revisited. As investors approach the threshold of retirement, the quest for financial […] |
Dividend Contenders List Ranked By Yield: Top 25In this article, we discuss top 25 dividend contenders according to yields. You can skip our detailed analysis of dividend stocks and their previous performance, and go directly to read Dividend Contenders List Ranked By Yield: Top 10. Dividend contenders typically refer to companies that have consistently increased their dividends for at least 10 consecutive […] |
Want To Defeat Inflation? Three REITs That Keep Raising DividendsAlthough recent consumer price index (CPI) reports have signified that inflation levels are slowly declining from the much higher percentages of the past two years, inflation remains a problem for many Americans, especially those on fixed incomes in retirement. But many retirees or those nearing retirement age benefit from investing in dividend stocks, such as real estate investment trusts (REITs), because the monthly or quarterly payments help them in paying ongoing expenses. And unlike a CD, h |
Is Mid-America's (MAA) Latest Dividend Hike Sustainable?Mid-America's (MAA) recent dividend hike of 5% is likely to be sustainable, given the company's operational and financial strength. |
CubeSmart Announces 4.1% Increase in Quarterly Common DividendMALVERN, Pa., Dec. 07, 2023 (GLOBE NEWSWIRE) -- CubeSmart (NYSE: CUBE) announced today that its Board of Trustees declared a quarterly dividend of $0.51 per common share for the period ending December 31, 2023. The dividend is payable on January 16, 2024 to common shareholders of record on January 2, 2024. The quarterly distribution represents an annualized dividend rate of $2.04 per share, an increase of $0.08 per share from the previous annual rate of $1.96 per share. “We are proud to announce |
CUBE Price Returns
| 1-mo | 7.32% |
| 3-mo | 18.22% |
| 6-mo | 9.08% |
| 1-year | 14.42% |
| 3-year | 10.32% |
| 5-year | 75.20% |
| YTD | 5.15% |
| 2023 | 20.50% |
| 2022 | -26.31% |
| 2021 | 74.58% |
| 2020 | 11.67% |
| 2019 | 14.12% |
CUBE Dividends
| Ex-Dividend Date | Type | Payout Amount | Change | ||||||
|---|---|---|---|---|---|---|---|---|---|
| Loading, please wait... | |||||||||
Continue Researching CUBE
Want to see what other sources are saying about CubeSmart's financials and stock price? Try the links below:CubeSmart (CUBE) Stock Price | Nasdaq
CubeSmart (CUBE) Stock Quote, History and News - Yahoo Finance
CubeSmart (CUBE) Stock Price and Basic Information | MarketWatch
Loading social stream, please wait...