CVB Financial Corporation (CVBF): Price and Financial Metrics
GET POWR RATINGS... FREE!
CVBF POWR Grades
- CVBF scores best on the Momentum dimension, with a Momentum rank ahead of 83.6% of US stocks.
- The strongest trend for CVBF is in Sentiment, which has been heading down over the past 177 days.
- CVBF's current lowest rank is in the Value metric (where it is better than 3.58% of US stocks).
CVBF Stock Summary
- CVBF's one year PEG ratio, measuring expected growth in earnings next year relative to current common stock price is 5,719.22 -- higher than 99.51% of US-listed equities with positive expected earnings growth.
- With a year-over-year growth in debt of -29.07%, CVB FINANCIAL CORP's debt growth rate surpasses just 10.91% of about US stocks.
- In terms of volatility of its share price, CVBF is more volatile than only 6.46% of stocks we're observing.
- Stocks that are quantitatively similar to CVBF, based on their financial statements, market capitalization, and price volatility, are KNSL, CZWI, ONB, WEN, and WAT.
- CVBF's SEC filings can be seen here. And to visit CVB FINANCIAL CORP's official web site, go to www.cbbank.com.
CVBF Valuation Summary
- CVBF's price/earnings ratio is 16.4; this is 38.98% higher than that of the median Financial Services stock.
- CVBF's price/sales ratio has moved up 0.6 over the prior 243 months.
Below are key valuation metrics over time for CVBF.
Stock | Date | P/S | P/B | P/E | EV/EBIT |
---|---|---|---|---|---|
CVBF | 2023-02-03 | 7.0 | 1.9 | 16.4 | 12.3 |
CVBF | 2023-02-02 | 6.9 | 1.9 | 16.3 | 12.2 |
CVBF | 2023-02-01 | 6.6 | 1.8 | 15.7 | 11.7 |
CVBF | 2023-01-31 | 6.6 | 1.8 | 15.6 | 11.7 |
CVBF | 2023-01-30 | 6.5 | 1.8 | 15.4 | 11.5 |
CVBF | 2023-01-27 | 6.5 | 1.8 | 15.4 | 11.5 |
CVBF Growth Metrics
- The 5 year price growth rate now stands at -14.65%.
- Its 4 year net income to common stockholders growth rate is now at 82.24%.
- Its 5 year net income to common stockholders growth rate is now at 82.24%.

The table below shows CVBF's growth in key financial areas (numbers in millions of US dollars).
Date | Revenue | Operating Cash Flow | Net Income to Common Stock |
---|---|---|---|
2022-09-30 | 512.322 | 261.508 | 216.953 |
2022-06-30 | 487.176 | 252.931 | 202.067 |
2022-03-31 | 472.39 | 223.416 | 194.188 |
2021-12-31 | 487.435 | 195.242 | 212.521 |
2021-09-30 | 491.433 | 183.657 | 214.881 |
2021-06-30 | 490.129 | 158.714 | 212.62 |
CVBF's Quality Factors
The “Quality” component of the POWR Ratings focuses on 31 different factors of a companies fundamentals and operational strength. Here are some key insights as we drill into the specifics of these quality attributes.- CVBF has a Quality Grade of C, ranking ahead of 32.38% of graded US stocks.
- CVBF's asset turnover comes in at 0.033 -- ranking 321st of 428 Banking stocks.
- SYBT, TREE, and TSBK are the stocks whose asset turnover ratios are most correlated with CVBF.
The table below shows CVBF's key quality metrics over time.
Period | Asset Turnover | Gross Margin | ROIC |
---|---|---|---|
2021-06-30 | 0.033 | 1 | 0.024 |
2021-03-31 | 0.034 | 1 | 0.023 |
2020-12-31 | 0.033 | 1 | 0.021 |
2020-09-30 | 0.035 | 1 | 0.022 |
2020-06-30 | 0.037 | 1 | 0.023 |
2020-03-31 | 0.041 | 1 | 0.025 |
CVBF Price Target
For more insight on analysts targets of CVBF, see our CVBF price target page. And for a list of of all stocks sorted by upside potential based on analyst target price, see our Top Price Target page.
Average Price Target | $22.50 | Average Broker Recommendation | 1.83 (Hold) |
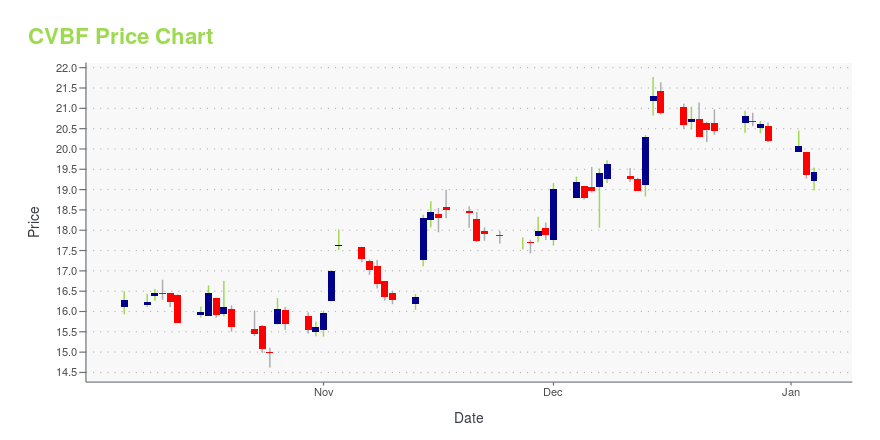
CVBF Stock Price Chart Interactive Chart >
CVBF Price/Volume Stats
Current price | $25.44 | 52-week high | $29.25 |
Prev. close | $25.21 | 52-week low | $22.20 |
Day low | $24.82 | Volume | 532,900 |
Day high | $25.53 | Avg. volume | 661,228 |
50-day MA | $25.84 | Dividend yield | 3.17% |
200-day MA | $25.82 | Market Cap | 3.56B |
CVB Financial Corporation (CVBF) Company Bio
CVB Financial Corp. provides various banking and trust services for businesses, professionals, and individuals in the Inland Empire, Los Angeles County, Orange County, San Diego County, and the Central Valley areas of California. The company was founded in 1974 and is based in Ontario, California.
Latest CVBF News From Around the Web
Below are the latest news stories about CVB FINANCIAL CORP that investors may wish to consider to help them evaluate CVBF as an investment opportunity.
CVB Financial Corp. (CVBF) Q4 2022 Earnings Call TranscriptCVB Financial Corp. (NASDAQ:NASDAQ:CVBF) Q4 2022 Earnings Conference Call January 26, 2023 10:30 AM ETCompany ParticipantsChristina Carrabino - Investor RelationsDave Brager - President and… |
CVB Financial Corp. 2022 Q4 - Results - Earnings Call PresentationThe following slide deck was published by CVB Financial Corp. |
CVB Financial (CVBF) Could Be a Great ChoiceDividends are one of the best benefits to being a shareholder, but finding a great dividend stock is no easy task. Does CVB Financial (CVBF) have what it takes? Let's find out. |
CVB Financial (CVBF) Q4 Earnings Meet EstimatesCVB Financial (CVBF) delivered earnings and revenue surprises of 0% and 1.14%, respectively, for the quarter ended December 2022. Do the numbers hold clues to what lies ahead for the stock? |
CVB Financial Corp. Reports Record Earnings for the Fourth Quarter and the Year Ended 2022Fourth Quarter 2022 Highlights |
CVBF Price Returns
1-mo | 2.25% |
3-mo | -11.45% |
6-mo | -6.50% |
1-year | 10.65% |
3-year | 31.81% |
5-year | 33.18% |
YTD | -1.20% |
2022 | 24.02% |
2021 | 13.58% |
2020 | -5.25% |
2019 | 10.19% |
2018 | -11.98% |
CVBF Dividends
Ex-Dividend Date | Type | Payout Amount | Change | ||||||
---|---|---|---|---|---|---|---|---|---|
Loading, please wait... |
Continue Researching CVBF
Here are a few links from around the web to help you further your research on Cvb Financial Corp's stock as an investment opportunity:Cvb Financial Corp (CVBF) Stock Price | Nasdaq
Cvb Financial Corp (CVBF) Stock Quote, History and News - Yahoo Finance
Cvb Financial Corp (CVBF) Stock Price and Basic Information | MarketWatch
Loading social stream, please wait...