Donaldson Company, Inc. (DCI): Price and Financial Metrics
GET POWR RATINGS... FREE!
DCI POWR Grades
- Stability is the dimension where DCI ranks best; there it ranks ahead of 91.62% of US stocks.
- DCI's strongest trending metric is Growth; it's been moving up over the last 179 days.
- DCI's current lowest rank is in the Momentum metric (where it is better than 53.2% of US stocks).
DCI Stock Summary
- The capital turnover (annual revenue relative to shareholder's equity) for DCI is 2.78 -- better than 82.28% of US stocks.
- DCI's went public 34.81 years ago, making it older than 91.85% of listed US stocks we're tracking.
- Of note is the ratio of Donaldson Co Inc's sales and general administrative expense to its total operating expenses; 85.61% of US stocks have a lower such ratio.
- If you're looking for stocks that are quantitatively similar to Donaldson Co Inc, a group of peers worth examining would be AYI, YETI, CNXC, FELE, and DORM.
- DCI's SEC filings can be seen here. And to visit Donaldson Co Inc's official web site, go to www.donaldson.com.
DCI Valuation Summary
- In comparison to the median Industrials stock, DCI's EV/EBIT ratio is 2.06% higher, now standing at 22.3.
- DCI's price/sales ratio has moved up 1.8 over the prior 243 months.
Below are key valuation metrics over time for DCI.
Stock | Date | P/S | P/B | P/E | EV/EBIT |
---|---|---|---|---|---|
DCI | 2021-09-03 | 2.9 | 6.8 | 29.3 | 22.3 |
DCI | 2021-09-02 | 3.0 | 7.0 | 30.3 | 23.1 |
DCI | 2021-09-01 | 3.1 | 7.3 | 31.7 | 24.1 |
DCI | 2021-08-31 | 3.2 | 7.4 | 31.9 | 24.3 |
DCI | 2021-08-30 | 3.2 | 7.5 | 32.5 | 24.7 |
DCI | 2021-08-27 | 3.2 | 7.5 | 32.4 | 24.6 |
DCI Growth Metrics
- The 3 year price growth rate now stands at 35.9%.
- Its 4 year net cashflow from operations growth rate is now at 53.05%.
- The 4 year net income to common stockholders growth rate now stands at 33.77%.

The table below shows DCI's growth in key financial areas (numbers in millions of US dollars).
Date | Revenue | Operating Cash Flow | Net Income to Common Stock |
---|---|---|---|
2021-12-31 | 3,101.5 | 279.4 | 317.6 |
2021-09-30 | 2,978.1 | 315.9 | 302 |
2021-06-30 | 2,853.9 | 401.9 | 286.9 |
2021-03-31 | 2,698.1 | 427.4 | 266.6 |
2020-12-31 | 2,562.8 | 412.5 | 245.6 |
2020-09-30 | 2,545.7 | 429.8 | 253.8 |
DCI's Quality Factors
The “Quality” component of the POWR Ratings focuses on 31 different factors of a companies fundamentals and operational strength. Here are some key insights as we drill into the specifics of these quality attributes.- DCI has a Quality Grade of A, ranking ahead of 95.05% of graded US stocks.
- DCI's asset turnover comes in at 1.228 -- ranking 9th of 104 Machinery stocks.
- CMI, KMT, and PFIN are the stocks whose asset turnover ratios are most correlated with DCI.
The table below shows DCI's key quality metrics over time.
Period | Asset Turnover | Gross Margin | ROIC |
---|---|---|---|
2021-07-31 | 1.228 | 0.340 | 0.222 |
2021-04-30 | 1.181 | 0.339 | 0.199 |
2021-01-31 | 1.124 | 0.338 | 0.177 |
2020-10-31 | 1.117 | 0.339 | 0.179 |
2020-07-31 | 1.131 | 0.338 | 0.179 |
2020-04-30 | 1.193 | 0.337 | 0.193 |
DCI Price Target
For more insight on analysts targets of DCI, see our DCI price target page. And for a list of of all stocks sorted by upside potential based on analyst target price, see our Top Price Target page.
Average Price Target | $71.00 | Average Broker Recommendation | 1.75 (Moderate Buy) |
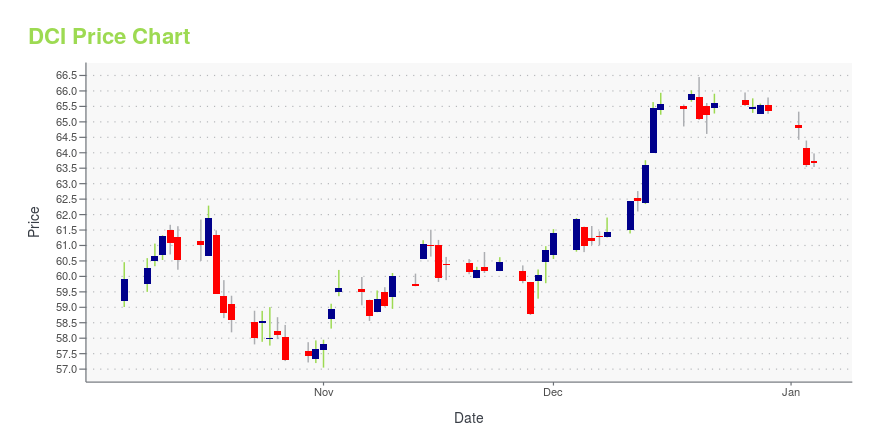
DCI Stock Price Chart Interactive Chart >
DCI Price/Volume Stats
Current price | $50.72 | 52-week high | $69.35 |
Prev. close | $49.73 | 52-week low | $48.13 |
Day low | $49.28 | Volume | 265,489 |
Day high | $50.74 | Avg. volume | 430,710 |
50-day MA | $51.13 | Dividend yield | 1.76% |
200-day MA | $56.89 | Market Cap | 6.27B |
Donaldson Company, Inc. (DCI) Company Bio
Donaldson Company manufactures and sell filtration systems and replacement parts. The company operates through two segments, Engine Products and Industrial Products. The company was founded in 1915 and is based in Minneapolis, Minnesota.
Latest DCI News From Around the Web
Below are the latest news stories about Donaldson Co Inc that investors may wish to consider to help them evaluate DCI as an investment opportunity.
Donaldson (DCI) Reports Next Week: Wall Street Expects Earnings GrowthDonaldson (DCI) doesn't possess the right combination of the two key ingredients for a likely earnings beat in its upcoming report. Get prepared with the key expectations. |
Donaldson Company (NYSE:DCI) Is Reinvesting To Multiply In ValueFinding a business that has the potential to grow substantially is not easy, but it is possible if we look at a few key... |
Credit Suisse posts $2.2B loss to end ''challenging year''GENEVA (AP) Credit Suisse on Thursday reported a fourth-quarter loss of 2 billion Swiss francs ($2.2 billion) as the top-drawer Swiss bank wrapped up a year of challenges marked by bad bets on a hedge fund, set asides for legal costs and accounting changes due to its acquisition of a U.S. investment bank over 20 years ago. The Zurich-based bank, the second largest in Switzerland''s active financial sector after rival UBS, said revenue in the fourth quarter fell 12%, to 4.6 billion francs, compared with a year earlier. It posted a pre-tax loss of 1.6 billion francs stemming in large part to goodwill linked to its acquisition of the Donaldson, Lufkin & Jenrette investment bank in 2000. Credit Suisse said that loss also stemmed from major litigation provisions and continued fallout from a... |
Ballast Advisors Llc Buys 3M Co, Eli Lilly and Co, Linde PLC, Sells Comcast Corp, Huntington ...Investment company Ballast Advisors Llc (Current Portfolio) buys 3M Co, Eli Lilly and Co, Linde PLC, Donaldson Co Inc, Equifax Inc, sells Comcast Corp, Huntington Bancshares Inc, Target Corp, iShares S&P Mid-Cap 400 Value ETF, iShares Russell Mid-Cap ETF during the 3-months ended 2021Q4, according to the most recent filings of the investment company, Ballast Advisors Llc. |
Tetra Tech (TTEK) Tops Q1 Earnings Estimates, Hikes FY22 ViewTetra Tech's (TTEK) fiscal first-quarter earnings reflect the impacts of improved revenues and margins. It increases earnings and revenue projections for fiscal 2022. |
DCI Price Returns
1-mo | -2.12% |
3-mo | -3.96% |
6-mo | -12.95% |
1-year | -14.98% |
3-year | 10.30% |
5-year | 17.48% |
YTD | -14.07% |
2021 | 7.56% |
2020 | -1.41% |
2019 | 34.98% |
2018 | -9.95% |
2017 | 18.16% |
DCI Dividends
Ex-Dividend Date | Type | Payout Amount | Change | ||||||
---|---|---|---|---|---|---|---|---|---|
Loading, please wait... |
Continue Researching DCI
Here are a few links from around the web to help you further your research on Donaldson Co Inc's stock as an investment opportunity:Donaldson Co Inc (DCI) Stock Price | Nasdaq
Donaldson Co Inc (DCI) Stock Quote, History and News - Yahoo Finance
Donaldson Co Inc (DCI) Stock Price and Basic Information | MarketWatch
Loading social stream, please wait...