DuPont de Nemours Inc. (DD): Price and Financial Metrics
DD Price/Volume Stats
Current price | $72.21 | 52-week high | $78.40 |
Prev. close | $67.44 | 52-week low | $49.52 |
Day low | $71.10 | Volume | 2,409,338 |
Day high | $72.23 | Avg. volume | 3,180,179 |
50-day MA | $68.23 | Dividend yield | 2.1% |
200-day MA | $66.12 | Market Cap | 33.15B |
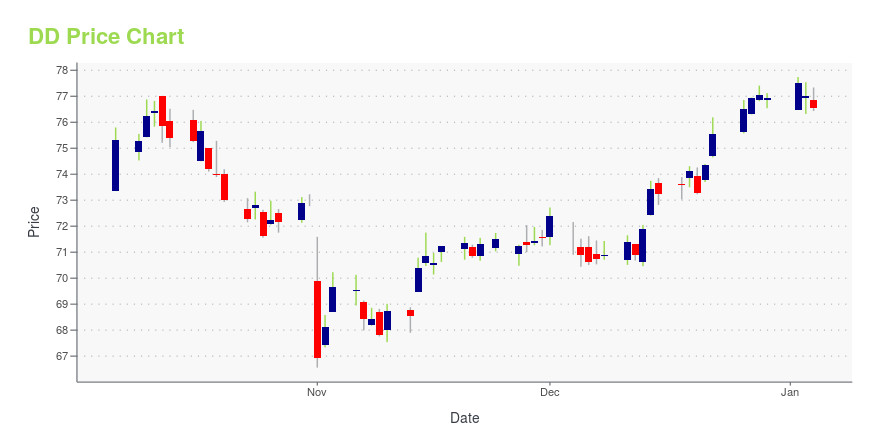
DD Stock Price Chart Interactive Chart >
DD POWR Grades
- Quality is the dimension where DD ranks best; there it ranks ahead of 63.95% of US stocks.
- DD's strongest trending metric is Growth; it's been moving down over the last 179 days.
- DD's current lowest rank is in the Momentum metric (where it is better than 19.66% of US stocks).
DD Stock Summary
- With a market capitalization of $30,419,041,480, DUPONT DE NEMOURS INC has a greater market value than 92.68% of US stocks.
- DD's went public 37.42 years ago, making it older than 93.61% of listed US stocks we're tracking.
- DUPONT DE NEMOURS INC's shareholder yield -- a measure of how much capital is returned to stockholders via dividends and buybacks -- is 24.77%, greater than the shareholder yield of 92.42% of stocks in our set.
- Stocks with similar financial metrics, market capitalization, and price volatility to DUPONT DE NEMOURS INC are PCAR, HOLX, HPE, CARR, and TEL.
- Visit DD's SEC page to see the company's official filings. To visit the company's web site, go to www.dupont.com.
DD Valuation Summary
- DD's price/sales ratio is 2.4; this is 41.18% higher than that of the median Basic Materials stock.
- Over the past 243 months, DD's EV/EBIT ratio has gone down 221.6.
Below are key valuation metrics over time for DD.
Stock | Date | P/S | P/B | P/E | EV/EBIT |
---|---|---|---|---|---|
DD | 2023-05-17 | 2.4 | 1.1 | 5.3 | 5.3 |
DD | 2023-05-16 | 2.3 | 1.1 | 5.3 | 5.3 |
DD | 2023-05-15 | 2.4 | 1.1 | 5.3 | 5.3 |
DD | 2023-05-12 | 2.3 | 1.1 | 5.2 | 5.2 |
DD | 2023-05-11 | 2.3 | 1.1 | 5.2 | 5.2 |
DD | 2023-05-10 | 2.3 | 1.1 | 5.2 | 5.2 |
DD Growth Metrics
- The 5 year revenue growth rate now stands at -57.94%.
- Its year over year net income to common stockholders growth rate is now at -48.97%.
- Its 4 year net cashflow from operations growth rate is now at -64.4%.

The table below shows DD's growth in key financial areas (numbers in millions of US dollars).
Date | Revenue | Operating Cash Flow | Net Income to Common Stock |
---|---|---|---|
2022-12-31 | 13,017 | 588 | 5,868 |
2022-09-30 | 14,184 | 1,335 | 1,846 |
2022-06-30 | 15,138 | 1,758 | 1,870 |
2022-03-31 | 15,951 | 2,112 | 1,561 |
2021-12-31 | 16,653 | 2,281 | 6,467 |
2021-09-30 | 17,634 | 2,961 | 6,485 |
DD's Quality Factors
The “Quality” component of the POWR Ratings focuses on 31 different factors of a companies fundamentals and operational strength. Here are some key insights as we drill into the specifics of these quality attributes.- DD has a Quality Grade of C, ranking ahead of 60.44% of graded US stocks.
- DD's asset turnover comes in at 0.335 -- ranking 73rd of 89 Chemicals stocks.
- CC, AVNT, and ASIX are the stocks whose asset turnover ratios are most correlated with DD.
The table below shows DD's key quality metrics over time.
Period | Asset Turnover | Gross Margin | ROIC |
---|---|---|---|
2021-09-30 | 0.335 | 0.350 | 0.272 |
2021-06-30 | 0.312 | 0.346 | 0.224 |
2021-03-31 | 0.297 | 0.336 | 0.114 |
2020-12-31 | 0.294 | 0.337 | -0.064 |
2020-09-30 | 0.295 | 0.341 | -0.066 |
2020-06-30 | 0.302 | 0.345 | -0.056 |
DD Price Target
For more insight on analysts targets of DD, see our DD price target page. And for a list of of all stocks sorted by upside potential based on analyst target price, see our Top Price Target page.
Average Price Target | $91.78 | Average Broker Recommendation | 1.57 (Moderate Buy) |
DuPont de Nemours Inc. (DD) Company Bio
DuPont de Nemours, Inc., commonly known as DuPont, is an American company formed by the merger of Dow Chemical and E. I. du Pont de Nemours and Company on August 31, 2017, and the subsequent spinoffs of Dow Inc. and Corteva. Prior to the spinoffs it was the world's largest chemical company in terms of sales. The merger has been reported to be worth an estimated $130 billion. With 2018 total revenue of $86 billion, DowDuPont ranked No. 35 on the 2019 Fortune 500 list of the largest United States public corporations. DuPont is headquartered in Wilmington, Delaware, in the state where it is incorporated, since the founding of the old DuPont in 1802. (Source:Wikipedia)
Latest DD News From Around the Web
Below are the latest news stories about DUPONT DE NEMOURS INC that investors may wish to consider to help them evaluate DD as an investment opportunity.
DuPont de Nemours (NYSE:DD) Is Paying Out A Larger Dividend Than Last YearDuPont de Nemours, Inc. ( NYSE:DD ) will increase its dividend from last year's comparable payment on the 15th of June... |
DuPont Wins Edie Award for Sustainability Benefits of Closed Circuit Reverse Osmosis TechnologyDuPont (NYSE:DD) recently received an Edie Award honoring the benefits of its Closed Circuit Reverse Osmosis (CCRO) technology in supporting industrial and commercial customers' sustainability goals. DuPont's CCRO technology received the top award in the Water, Waste and Resource Recovery category. The Edie Awards celebrate business sustainability. |
DuPont de Nemours, Inc. (NYSE:DD) is a favorite amongst institutional investors who own 80%Key Insights Institutions' substantial holdings in DuPont de Nemours implies that they have significant influence over... |
DuPont Earns Great Place to Work Certification™DuPont (NYSE: DD) today announced it has been Certified™ by Great Place to Work®, the global authority on workplace culture, employee experience, and leadership behaviors required for market-leading revenue, employee retention and innovation. The certification is based on what employees say about working at DuPont. |
DuPont Water Solutions Named 2023 Water Technology Company of the YearDuPont Water Solutions has been named Water Technology Company of the Year, presented at the Global Water Awards, for innovating solutions to sustainably address the hardest global water challenges. |
DD Price Returns
1-mo | 12.73% |
3-mo | -2.75% |
6-mo | 1.95% |
1-year | 7.11% |
3-year | 45.03% |
5-year | -14.22% |
YTD | 6.30% |
2022 | -13.36% |
2021 | 15.41% |
2020 | 13.28% |
2019 | -12.91% |
2018 | -23.15% |
DD Dividends
Ex-Dividend Date | Type | Payout Amount | Change | ||||||
---|---|---|---|---|---|---|---|---|---|
Loading, please wait... |
Loading social stream, please wait...