
Donegal Group, Inc. - (DGICA): Price and Financial Metrics
DGICA Price/Volume Stats
| Current price | $14.88 | 52-week high | $15.30 |
| Prev. close | $14.82 | 52-week low | $12.26 |
| Day low | $14.68 | Volume | 67,100 |
| Day high | $15.04 | Avg. volume | 56,443 |
| 50-day MA | $13.20 | Dividend yield | 4.93% |
| 200-day MA | $13.86 | Market Cap | 496.89M |
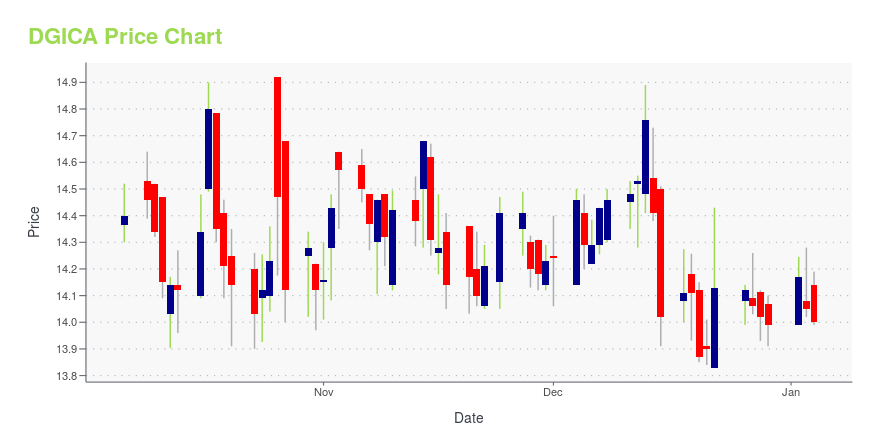
DGICA Stock Price Chart Interactive Chart >
Donegal Group, Inc. - (DGICA) Company Bio
Donegal Group provides property and casualty insurance to businesses and individuals in the Mid-Atlantic, Midwestern, New England, and southern states. It operates through Investment Function, Personal Lines of Insurance, Commercial Lines of Insurance, and Investment in DFSC segments. The company was founded in 1986 and is based in Marietta, Pennsylvania.
Latest DGICA News From Around the Web
Below are the latest news stories about DONEGAL GROUP INC that investors may wish to consider to help them evaluate DGICA as an investment opportunity.
Donegal Group Inc. Announces Quarterly DividendMARIETTA, Pa., Dec. 21, 2023 (GLOBE NEWSWIRE) -- Donegal Group Inc. (NASDAQ:DGICA) and (NASDAQ:DGICB) reported today that its board of directors declared a regular quarterly cash dividend of $0.17 per share of the Company’s Class A common stock and $0.1525 per share of the Company’s Class B common stock. The dividends are payable on February 15, 2024 to stockholders of record as of the close of business on February 1, 2024. About Donegal Group Inc. Donegal Group Inc. is an insurance holding comp |
Are Donegal Group Inc.'s (NASDAQ:DGIC.A) Mixed Financials Driving The Negative Sentiment?Donegal Group (NASDAQ:DGIC.A) has had a rough three months with its share price down 2.9%. It seems that the market... |
Donegal Group Inc. (NASDAQ:DGICA) Q3 2023 Earnings Call TranscriptDonegal Group Inc. (NASDAQ:DGICA) Q3 2023 Earnings Call Transcript October 26, 2023 Donegal Group Inc. misses on earnings expectations. Reported EPS is $-0.02422 EPS, expectations were $0.08. Karin Daly: Good morning, and thank you for joining us today. This morning, Donegal Group issued its third quarter 2023 earnings release outlining its results. The release and […] |
Donegal Group Inc. (NASDAQ:DGIC.A) Goes Ex-Dividend SoonReaders hoping to buy Donegal Group Inc. ( NASDAQ:DGIC.A ) for its dividend will need to make their move shortly, as... |
Donegal Group Inc (DGICA) Reports Q3 and First Nine Months of 2023 ResultsNet loss narrows, premiums earned and written increase, and combined ratio improves |
DGICA Price Returns
| 1-mo | 17.63% |
| 3-mo | 12.06% |
| 6-mo | 2.22% |
| 1-year | 3.61% |
| 3-year | 13.06% |
| 5-year | 30.93% |
| YTD | 8.95% |
| 2023 | 3.15% |
| 2022 | 4.02% |
| 2021 | 6.02% |
| 2020 | -1.12% |
| 2019 | 13.18% |
DGICA Dividends
| Ex-Dividend Date | Type | Payout Amount | Change | ||||||
|---|---|---|---|---|---|---|---|---|---|
| Loading, please wait... | |||||||||
Continue Researching DGICA
Want to do more research on Donegal Group Inc's stock and its price? Try the links below:Donegal Group Inc (DGICA) Stock Price | Nasdaq
Donegal Group Inc (DGICA) Stock Quote, History and News - Yahoo Finance
Donegal Group Inc (DGICA) Stock Price and Basic Information | MarketWatch
Loading social stream, please wait...