
D.R. Horton Inc. (DHI): Price and Financial Metrics
DHI Price/Volume Stats
| Current price | $176.94 | 52-week high | $180.15 |
| Prev. close | $172.70 | 52-week low | $100.08 |
| Day low | $175.56 | Volume | 3,353,461 |
| Day high | $180.15 | Avg. volume | 2,584,058 |
| 50-day MA | $148.54 | Dividend yield | 0.68% |
| 200-day MA | $142.41 | Market Cap | 58.27B |
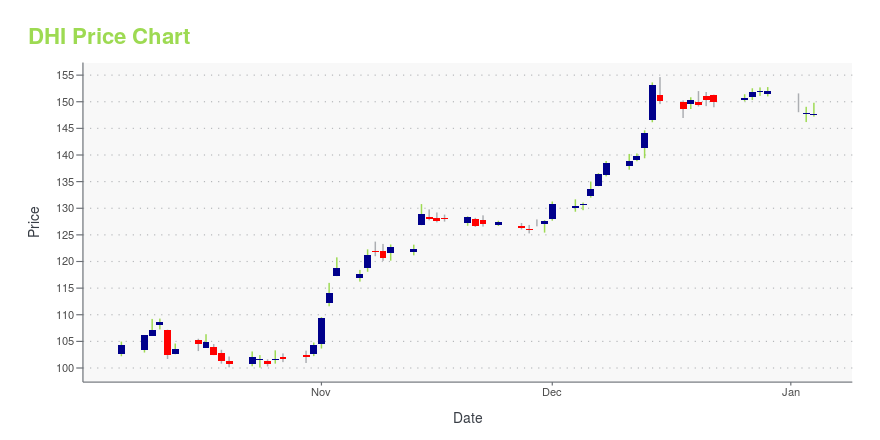
DHI Stock Price Chart Interactive Chart >
D.R. Horton Inc. (DHI) Company Bio
D.R. Horton, Inc. is a home construction company incorporated in Delaware and headquartered in Arlington, Texas. Since 2002, the company has been the largest homebuilder by volume in the United States. The company ranked number 194 on the 2019 Fortune 500 list of the largest United States corporations by revenue. The company operates in 90 markets in 29 states. (Source:Wikipedia)
Latest DHI News From Around the Web
Below are the latest news stories about HORTON D R INC that investors may wish to consider to help them evaluate DHI as an investment opportunity.
Best Performing Stocks In January Over The Last Two Decades (75%+ Win Rate)January is generally one of the weakest months of the year for the stock market, but the following stocks have excelled in January over the last 15 years or more. |
Top Performers: 7 High-Efficiency Stocks With Stellar Profit Per Employee RatiosInundated with myriad ways of assessing publicly traded companies, one unique metric could intrigue investors seeking opportunities in 2024 and that would be high-efficiency stocks. |
Can homebuilder stocks defy the odds in 2024?Homebuilder stocks soared in 2023, with notable gains in companies such as D.R. Horton (DHI), which is up 71%, Lennar (LEN) which is up 65%, and Beazer Homes (BZH) which is up 168%. Despite concerns about high interest rates and affordability, these companies have reported solid performances in the fourth quarter, expecting new order and delivery growth in the upcoming quarters. Other major players like Toll Brothers (TOL) also anticipate growth in 2024 and are strategically planning to expand communities and be prepared with inventory for the Spring selling season. Yahoo Finance's Jared Blikre breaks down this numbers—weighing in on what the industry can expect in 2024. For more Yahoo Finance housing coverage: 'Silver tsunami' to reshape the housing market: Meredith Whitney 2024 home b... |
20 Best States for Construction Jobs in the USIn this article, we will take a look at the 20 best states for construction jobs in the US. If you want to skip our discussion on the construction industry, you can go directly to the 5 Best States for Construction Jobs in the US. The construction sector serves as a significant indicator of economic […] |
D.R. Horton (DHI) Outperforms Broader Market: What You Need to KnowD.R. Horton (DHI) closed at $151.75 in the latest trading session, marking a +0.69% move from the prior day. |
DHI Price Returns
| 1-mo | 26.10% |
| 3-mo | 22.01% |
| 6-mo | 26.46% |
| 1-year | 40.46% |
| 3-year | 95.65% |
| 5-year | 318.92% |
| YTD | 16.91% |
| 2023 | 72.07% |
| 2022 | -16.83% |
| 2021 | 58.73% |
| 2020 | 32.23% |
| 2019 | 54.29% |
DHI Dividends
| Ex-Dividend Date | Type | Payout Amount | Change | ||||||
|---|---|---|---|---|---|---|---|---|---|
| Loading, please wait... | |||||||||
Continue Researching DHI
Want to see what other sources are saying about Horton D R Inc's financials and stock price? Try the links below:Horton D R Inc (DHI) Stock Price | Nasdaq
Horton D R Inc (DHI) Stock Quote, History and News - Yahoo Finance
Horton D R Inc (DHI) Stock Price and Basic Information | MarketWatch
Loading social stream, please wait...