
Dover Corp. (DOV): Price and Financial Metrics
DOV Price/Volume Stats
| Current price | $185.23 | 52-week high | $192.31 |
| Prev. close | $186.32 | 52-week low | $127.25 |
| Day low | $184.52 | Volume | 1,412,003 |
| Day high | $188.11 | Avg. volume | 1,017,822 |
| 50-day MA | $181.67 | Dividend yield | 1.13% |
| 200-day MA | $162.75 | Market Cap | 25.46B |
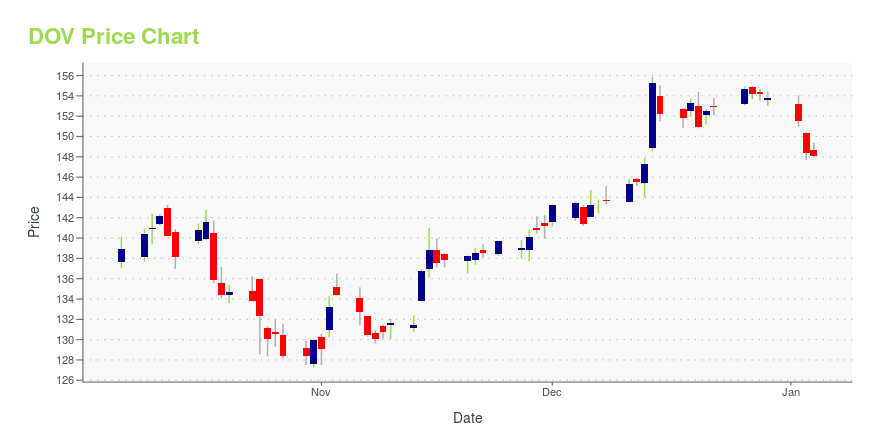
DOV Stock Price Chart Interactive Chart >
Dover Corp. (DOV) Company Bio
Dover Corporation is an American conglomerate manufacturer of industrial products. The Downers Grove, Illinois-based company was founded in 1955. As of 2021, Dover's business was divided into five segments: Engineered Products, Clean Energy and Fueling, Imaging & Identification, Pumps & Process Solutions and Climate and Sustainability Technologies. Dover is a constituent of the S&P 500 index and trades on the New York Stock Exchange under "DOV". Dover was ranked 429th in the 2020 Fortune 500. The company relocated its headquarters to Illinois from New York in mid-2010. (Source:Wikipedia)
Latest DOV News From Around the Web
Below are the latest news stories about DOVER CORP that investors may wish to consider to help them evaluate DOV as an investment opportunity.
The 3 Best Industrial Stocks to Buy for 2024Industrial stocks present value despite short-term challenges. |
Those who invested in Dover (NYSE:DOV) five years ago are up 136%The worst result, after buying shares in a company (assuming no leverage), would be if you lose all the money you put... |
Markem-Imaje Achieves BRC Global Standard Grade AA Packaging Materials CertificationMarkem-Imaje, part of Dover (NYSE: DOV) and a global provider of end-to-end supply chain solutions and industrial marking and coding systems, announced that it has received the BRC Global Standard (BRCGS) Grade AA Packaging Materials Certification. This award reflects the exceptional standards at the Markem-Imaje manufacturing site for Continuous Inkjet (CIJ) inks in Bourg-Lès-Valence, France. Markem-Imaje is the first coding company in Europe to achieve a BRC Global Standard. |
Caldera Announces New RIP Software Version 17Caldera, part of Dover (NYSE: DOV), today announced the launch of Version 17 of its award-winning raster image processor ("RIP") software for large-format digital printing and cutting. Version 17 includes the official support of macOS® Sonoma, the integration of Adobe® PDF Print Engine 6.2, more than 30 new drivers, and an extended range of new features to facilitate color management, printing and cutting tasks. |
Are Robust Financials Driving The Recent Rally In Dover Corporation's (NYSE:DOV) Stock?Most readers would already be aware that Dover's (NYSE:DOV) stock increased significantly by 10% over the past month... |
DOV Price Returns
| 1-mo | 3.64% |
| 3-mo | 3.10% |
| 6-mo | 24.27% |
| 1-year | 28.72% |
| 3-year | 17.74% |
| 5-year | 103.42% |
| YTD | 21.14% |
| 2023 | 15.22% |
| 2022 | -24.34% |
| 2021 | 45.73% |
| 2020 | 11.53% |
| 2019 | 65.80% |
DOV Dividends
| Ex-Dividend Date | Type | Payout Amount | Change | ||||||
|---|---|---|---|---|---|---|---|---|---|
| Loading, please wait... | |||||||||
Continue Researching DOV
Here are a few links from around the web to help you further your research on DOVER Corp's stock as an investment opportunity:DOVER Corp (DOV) Stock Price | Nasdaq
DOVER Corp (DOV) Stock Quote, History and News - Yahoo Finance
DOVER Corp (DOV) Stock Price and Basic Information | MarketWatch
Loading social stream, please wait...