DURECT Corporation (DRRX): Price and Financial Metrics
DRRX Price/Volume Stats
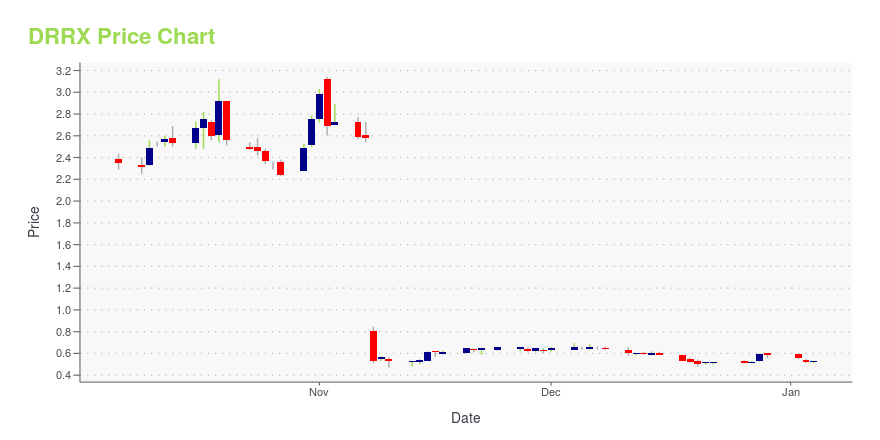
Current price | $2.49 | 52-week high | $9.50 |
Prev. close | $2.47 | 52-week low | $2.41 |
Day low | $2.41 | Volume | 228,500 |
Day high | $2.51 | Avg. volume | 161,654 |
50-day MA | $3.04 | Dividend yield | N/A |
200-day MA | $4.57 | Market Cap | 68.72M |
DRRX Stock Price Chart Interactive Chart >
DRRX POWR Grades
- DRRX scores best on the Quality dimension, with a Quality rank ahead of 64.71% of US stocks.
- The strongest trend for DRRX is in Stability, which has been heading down over the past 177 days.
- DRRX ranks lowest in Stability; there it ranks in the 6th percentile.
DRRX Stock Summary
- The capital turnover (annual revenue relative to shareholder's equity) for DRRX is 3.53 -- better than 85.15% of US stocks.
- Of note is the ratio of DURECT CORP's sales and general administrative expense to its total operating expenses; just 13.59% of US stocks have a lower such ratio.
- Revenue growth over the past 12 months for DURECT CORP comes in at 44.41%, a number that bests 87.54% of the US stocks we're tracking.
- Stocks that are quantitatively similar to DRRX, based on their financial statements, market capitalization, and price volatility, are BYSI, MEIP, PULM, EIGR, and BLPH.
- Visit DRRX's SEC page to see the company's official filings. To visit the company's web site, go to www.durect.com.
DRRX Valuation Summary
- In comparison to the median Healthcare stock, DRRX's price/earnings ratio is 107.49% lower, now standing at -2.
- DRRX's price/sales ratio has moved down 14.2 over the prior 243 months.
Below are key valuation metrics over time for DRRX.
Stock | Date | P/S | P/B | P/E | EV/EBIT |
---|---|---|---|---|---|
DRRX | 2023-09-22 | 3.8 | 13.3 | -2.0 | -1.9 |
DRRX | 2023-09-21 | 3.9 | 13.6 | -2.1 | -2.0 |
DRRX | 2023-09-20 | 4.0 | 14.1 | -2.2 | -2.1 |
DRRX | 2023-09-19 | 4.2 | 14.9 | -2.3 | -2.2 |
DRRX | 2023-09-18 | 3.9 | 13.8 | -2.1 | -2.0 |
DRRX | 2023-09-15 | 4.1 | 14.5 | -2.2 | -2.1 |
DRRX Growth Metrics
- Its 5 year net income to common stockholders growth rate is now at 32.71%.
- Its 4 year net cashflow from operations growth rate is now at 112.96%.
- The 2 year revenue growth rate now stands at -51.5%.

The table below shows DRRX's growth in key financial areas (numbers in millions of US dollars).
Date | Revenue | Operating Cash Flow | Net Income to Common Stock |
---|---|---|---|
2022-09-30 | 23.265 | -28.98 | -31.872 |
2022-06-30 | 13.453 | -34.11 | -39.378 |
2022-03-31 | 13.68 | -32.161 | -36.973 |
2021-12-31 | 13.977 | -37.311 | -36.265 |
2021-09-30 | 5.489 | -34.58 | -24.897 |
2021-06-30 | 6.007 | -35.905 | -24.252 |
DRRX's Quality Factors
The “Quality” component of the POWR Ratings focuses on 31 different factors of a companies fundamentals and operational strength. Here are some key insights as we drill into the specifics of these quality attributes.- DRRX has a Quality Grade of C, ranking ahead of 38.99% of graded US stocks.
- DRRX's asset turnover comes in at 0.065 -- ranking 305th of 680 Pharmaceutical Products stocks.
- CCXI, LCI, and BHC are the stocks whose asset turnover ratios are most correlated with DRRX.
The table below shows DRRX's key quality metrics over time.
Period | Asset Turnover | Gross Margin | ROIC |
---|---|---|---|
2021-06-30 | 0.065 | 1.013 | -0.373 |
2021-03-31 | 0.353 | 0.982 | 0.023 |
2020-12-31 | 0.412 | 0.953 | 0.031 |
2020-09-30 | 0.554 | 0.889 | -0.138 |
2020-06-30 | 0.624 | 0.914 | 0.013 |
2020-03-31 | 0.366 | 0.850 | -0.615 |
DRRX Price Target
For more insight on analysts targets of DRRX, see our DRRX price target page. And for a list of of all stocks sorted by upside potential based on analyst target price, see our Top Price Target page.
Average Price Target | $6.50 | Average Broker Recommendation | 1.33 (Strong Buy) |
DURECT Corporation (DRRX) Company Bio
DURECT Corporation, a specialty pharmaceutical company, focuses on the development of pharmaceuticals products based on its proprietary drug formulations and delivery platform technologies in the United States, Europe, Japan, and internationally. The company was founded in 1998 and is based in Cupertino, California.
Latest DRRX News From Around the Web
Below are the latest news stories about DURECT CORP that investors may wish to consider to help them evaluate DRRX as an investment opportunity.
DURECT Corporation Announces Last Patient Last Visit in Phase 2b AHFIRM Trial of Larsucosterol in Alcohol-Associated HepatitisDURECT Corporation (Nasdaq: DRRX), a late-stage biopharmaceutical company pioneering the development of epigenetic therapies to transform the treatment of serious and life-threatening conditions, including acute organ injury and cancer, today announced that the last patient has completed the study protocol in the Company's AHFIRM trial. AHFIRM is a Phase 2b randomized, double-blind, placebo-controlled trial evaluating the safety and efficacy of lasucosterol in subjects with severe alcohol-associ |
DURECT Corporation Announces Presentations in Upcoming Investor ConferencesDURECT Corporation (Nasdaq: DRRX), a biopharmaceutical company committed to transforming the treatment of acute organ injury and chronic liver diseases by advancing novel and potentially lifesaving therapies based on its endogenous epigenetic regulator program, will present in the following September 2023 conferences. |
10 Oversold Penny Stocks To BuyIn this article, we will take a look at the 10 oversold penny stocks to buy. To see more such companies, go directly to 5 Oversold Penny Stocks To Buy. As markets rebound on the back of declining inflation and hopes that the Federal Reserve might be close to winning its battle against inflation, investors […] |
Q2 2023 DURECT Corp Earnings CallQ2 2023 DURECT Corp Earnings Call |
Durect (DRRX) Reports Q2 Loss, Misses Revenue EstimatesDurect (DRRX) delivered earnings and revenue surprises of -2.22% and 27.99%, respectively, for the quarter ended June 2023. Do the numbers hold clues to what lies ahead for the stock? |
DRRX Price Returns
1-mo | -18.49% |
3-mo | N/A |
6-mo | -39.42% |
1-year | -56.94% |
3-year | -86.24% |
5-year | -77.36% |
YTD | -28.03% |
2022 | -64.91% |
2021 | -52.37% |
2020 | -45.53% |
2019 | 691.67% |
2018 | -47.83% |
Continue Researching DRRX
Here are a few links from around the web to help you further your research on Durect Corp's stock as an investment opportunity:Durect Corp (DRRX) Stock Price | Nasdaq
Durect Corp (DRRX) Stock Quote, History and News - Yahoo Finance
Durect Corp (DRRX) Stock Price and Basic Information | MarketWatch
Loading social stream, please wait...