DTE Energy Co. (DTE): Price and Financial Metrics
DTE Price/Volume Stats
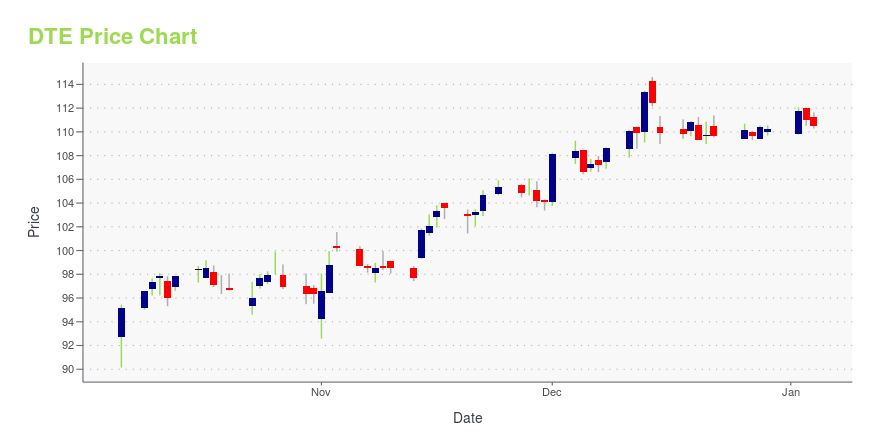
Current price | $99.28 | 52-week high | $122.40 |
Prev. close | $98.63 | 52-week low | $98.40 |
Day low | $98.40 | Volume | 1,268,500 |
Day high | $100.32 | Avg. volume | 1,220,160 |
50-day MA | $106.58 | Dividend yield | 3.79% |
200-day MA | $110.83 | Market Cap | 20.47B |
DTE Stock Price Chart Interactive Chart >
DTE POWR Grades
- Sentiment is the dimension where DTE ranks best; there it ranks ahead of 68.51% of US stocks.
- The strongest trend for DTE is in Growth, which has been heading down over the past 177 days.
- DTE ranks lowest in Quality; there it ranks in the 12th percentile.
DTE Stock Summary
- DTE's went public 37.76 years ago, making it older than 93.16% of listed US stocks we're tracking.
- Of note is the ratio of DTE ENERGY CO's sales and general administrative expense to its total operating expenses; just 0.26% of US stocks have a lower such ratio.
- In terms of volatility of its share price, DTE is more volatile than merely 1.99% of stocks we're observing.
- If you're looking for stocks that are quantitatively similar to DTE ENERGY CO, a group of peers worth examining would be EIX, AGR, CNP, AEE, and CMS.
- DTE's SEC filings can be seen here. And to visit DTE ENERGY CO's official web site, go to newlook.dteenergy.com.
DTE Valuation Summary
- DTE's price/sales ratio is 1.4; this is 33.33% lower than that of the median Utilities stock.
- Over the past 243 months, DTE's EV/EBIT ratio has gone up 4.
Below are key valuation metrics over time for DTE.
Stock | Date | P/S | P/B | P/E | EV/EBIT |
---|---|---|---|---|---|
DTE | 2023-09-22 | 1.4 | 2.1 | 16.9 | 19.3 |
DTE | 2023-09-21 | 1.4 | 2.1 | 16.9 | 19.3 |
DTE | 2023-09-20 | 1.4 | 2.1 | 16.9 | 19.4 |
DTE | 2023-09-19 | 1.4 | 2.1 | 16.9 | 19.3 |
DTE | 2023-09-18 | 1.4 | 2.1 | 17.0 | 19.4 |
DTE | 2023-09-15 | 1.4 | 2.1 | 17.0 | 19.4 |
DTE Growth Metrics
- The 4 year net income to common stockholders growth rate now stands at 8.52%.
- Its 4 year net cashflow from operations growth rate is now at 38.87%.
- Its year over year net cashflow from operations growth rate is now at -23.69%.

The table below shows DTE's growth in key financial areas (numbers in millions of US dollars).
Date | Revenue | Operating Cash Flow | Net Income to Common Stock |
---|---|---|---|
2022-12-31 | 19,228 | 1,977 | 1,083 |
2022-09-30 | 19,399 | 2,107 | 1,124 |
2022-06-30 | 17,863 | 2,287 | 762 |
2022-03-31 | 16,168 | 2,818 | 904 |
2021-12-31 | 14,964 | 3,067 | 907 |
2021-09-30 | 14,010 | 3,288 | 876 |
DTE's Quality Factors
The “Quality” component of the POWR Ratings focuses on 31 different factors of a companies fundamentals and operational strength. Here are some key insights as we drill into the specifics of these quality attributes.- DTE has a Quality Grade of D, ranking ahead of 12.96% of graded US stocks.
- DTE's asset turnover comes in at 0.309 -- ranking 23rd of 105 Utilities stocks.
- BKH, IDA, and EXC are the stocks whose asset turnover ratios are most correlated with DTE.
The table below shows DTE's key quality metrics over time.
Period | Asset Turnover | Gross Margin | ROIC |
---|---|---|---|
2021-09-30 | 0.309 | 0.264 | 0.028 |
2021-06-30 | 0.292 | 0.287 | 0.038 |
2021-03-31 | 0.287 | 0.301 | 0.041 |
2020-12-31 | 0.275 | 0.318 | 0.041 |
2020-09-30 | 0.278 | 0.314 | 0.042 |
2020-06-30 | 0.284 | 0.303 | 0.040 |
DTE Price Target
For more insight on analysts targets of DTE, see our DTE price target page. And for a list of of all stocks sorted by upside potential based on analyst target price, see our Top Price Target page.
Average Price Target | $128.20 | Average Broker Recommendation | 1.67 (Moderate Buy) |
DTE Energy Co. (DTE) Company Bio
DTE Energy (formerly Detroit Edison until 1996) is a Detroit-based diversified energy company involved in the development and management of energy-related businesses and services in the United States and Canada. Its operating units include an electric utility serving 2.2 million customers and a natural gas utility serving 1.3 million customers in Michigan. (Source:Wikipedia)
Latest DTE News From Around the Web
Below are the latest news stories about DTE ENERGY CO that investors may wish to consider to help them evaluate DTE as an investment opportunity.
Are You a Momentum Investor? This 1 Stock Could Be the Perfect PickWhether you're a value, growth, or momentum investor, finding strong stocks becomes easier with the Zacks Style Scores, a top feature of the Zacks Premium research service. |
Why This 1 Value Stock Could Be a Great Addition to Your PortfolioWhether you're a value, growth, or momentum investor, finding strong stocks becomes easier with the Zacks Style Scores, a top feature of the Zacks Premium research service. |
Federal Reserve Likely to Maintain Rates Amid Mixed Economic IndicatorsThe Federal Open Market Committee (FOMC) of the U.S. Federal Reserve is set to meet on September 19-20, 2023, with market expectations suggesting a pause in rate hikes, keeping the rate at 5.25%–5.5%, a level close to a 22-year-high. This follows a series of rate increases aimed at maximizing employment and maintaining inflation at around 2%. |
10 Reddit Stocks with Biggest UpsideIn this article, we will take a look at the 10 Reddit stocks with biggest upside . To see more such companies, go directly to 5 Reddit Stocks with Biggest Upside. Rising inflation and persistent rate hikes have finally started to show their real effects. As inflation eats into the savings of millions of Americans, […] |
Unraveling the Dividend Story of DTE Energy CoDTE Energy Co(NYSE:DTE) recently announced a dividend of $0.95 per share, payable on 2023-10-15, with the ex-dividend date set for 2023-09-15. As investors look forward to this upcoming payment, the spotlight also shines on the company's dividend history, yield, and growth rates. Using the data from GuruFocus, let's deep dive into DTE Energy Co's dividend performance and assess its sustainability. |
DTE Price Returns
1-mo | -3.10% |
3-mo | -8.95% |
6-mo | -7.31% |
1-year | -10.70% |
3-year | 13.95% |
5-year | 28.69% |
YTD | -13.29% |
2022 | 1.23% |
2021 | 21.92% |
2020 | -2.86% |
2019 | 21.39% |
2018 | 4.20% |
DTE Dividends
Ex-Dividend Date | Type | Payout Amount | Change | ||||||
---|---|---|---|---|---|---|---|---|---|
Loading, please wait... |
Continue Researching DTE
Want to do more research on Dte Energy Co's stock and its price? Try the links below:Dte Energy Co (DTE) Stock Price | Nasdaq
Dte Energy Co (DTE) Stock Quote, History and News - Yahoo Finance
Dte Energy Co (DTE) Stock Price and Basic Information | MarketWatch
Loading social stream, please wait...