Dynex Capital, Inc. (DX): Price and Financial Metrics

Dynex Capital, Inc. (DX): $11.18

-0.04 (-0.36%)

POWR Rating

Component Grades

Momentum

C

Stability

C

Sentiment

Quality

C

Add DX to Watchlist
Sign Up

Industry: REITs - Mortgage

Industry

F

Ranked

#26 of 27

in industry

DX Price/Volume Stats
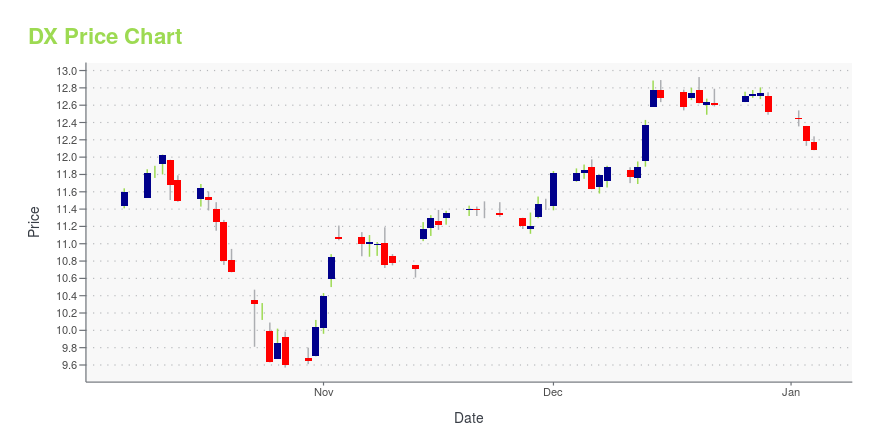
Current price $11.18 52-week high $17.06
Prev. close $11.22 52-week low $10.39
Day low $11.07 Volume 424,698
Day high $11.28 Avg. volume 1,068,823
50-day MA $11.48 Dividend yield 14.3%
200-day MA $12.93 Market Cap 604.99M

DX Stock Price Chart Interactive Chart >

DX POWR Grades

  • DX scores best on the Momentum dimension, with a Momentum rank ahead of 42.84% of US stocks.
  • The strongest trend for DX is in Momentum, which has been heading down over the past 179 days.
  • DX ranks lowest in Value; there it ranks in the 2nd percentile.

DX Stock Summary

  • DYNEX CAPITAL INC's capital turnover -- a measure of revenue relative to shareholder's equity -- is better than just 6.82% of US listed stocks.
  • The ratio of debt to operating expenses for DYNEX CAPITAL INC is higher than it is for about 99% of US stocks.
  • As for revenue growth, note that DX's revenue has grown -165.85% over the past 12 months; that beats the revenue growth of only 0.19% of US companies in our set.
  • Stocks with similar financial metrics, market capitalization, and price volatility to DYNEX CAPITAL INC are RWT, GPMT, CIM, BLX, and LFT.
  • DX's SEC filings can be seen here. And to visit DYNEX CAPITAL INC's official web site, go to www.dynexcapital.com.

DX Valuation Summary

  • In comparison to the median Real Estate stock, DX's price/sales ratio is 192.68% lower, now standing at -3.8.
  • Over the past 243 months, DX's price/earnings ratio has gone down 20.5.

Below are key valuation metrics over time for DX.

Stock Date P/S P/B P/E EV/EBIT
DX 2023-05-11 -3.8 0.7 -25.3 -199.0
DX 2023-05-10 -3.8 0.7 -25.5 -199.3
DX 2023-05-09 -3.8 0.7 -25.5 -199.2
DX 2023-05-08 -3.8 0.7 -25.4 -199.1
DX 2023-05-05 -3.7 0.7 -25.2 -198.8
DX 2023-05-04 -3.7 0.7 -24.7 -198.0

DX Growth Metrics

    Its year over year revenue growth rate is now at -42.48%.
  • Its year over year net income to common stockholders growth rate is now at -75.21%.
  • The year over year cash and equivalents growth rate now stands at 51.19%.
Over the past 49 months, DX's revenue has gone up $292,055,000.

The table below shows DX's growth in key financial areas (numbers in millions of US dollars).

Date Revenue Operating Cash Flow Net Income to Common Stock
2022-09-30 416.07 134.522 106.236
2022-06-30 332.913 149.858 166.943
2022-03-31 239.801 151.333 93.848
2021-12-31 127.688 146.97 90.945
2021-09-30 154.463 152.702 116.004
2021-06-30 179.278 158.337 141.367

DX's Quality Factors

The “Quality” component of the POWR Ratings focuses on 31 different factors of a companies fundamentals and operational strength. Here are some key insights as we drill into the specifics of these quality attributes.
  • DX has a Quality Grade of B, ranking ahead of 77.88% of graded US stocks.
  • DX's asset turnover comes in at 0.049 -- ranking 300th of 444 Trading stocks.
  • BEN, MS, and ACC are the stocks whose asset turnover ratios are most correlated with DX.

The table below shows DX's key quality metrics over time.

Period Asset Turnover Gross Margin ROIC
2021-09-30 0.049 1 0.025
2021-06-30 0.057 1 0.030
2021-03-31 0.127 1 0.070
2020-12-31 0.051 1 0.026
2020-09-30 0.047 1 0.024
2020-06-30 0.026 1 0.012

DX Price Target

For more insight on analysts targets of DX, see our DX price target page. And for a list of of all stocks sorted by upside potential based on analyst target price, see our Top Price Target page.

Average Price Target $19.70 Average Broker Recommendation 1.58 (Moderate Buy)

Dynex Capital, Inc. (DX) Company Bio


Dynex Capital, Inc., a mortgage real estate investment trust, invests in mortgage securities on a leveraged basis in the United States. It invests in residential mortgage-backed securities and commercial mortgage-backed securities (CMBS), including CMBS interest-only securities guaranteed by an agency of the U.S. government or a U.S. government-sponsored entity; non-agency mortgage-backed securities; and securitized and unsecuritized mortgage loans. The company was founded in 1987 and is based in Glen Allen, Virginia.


DX Latest News Stream


Event/Time News Detail
Loading, please wait...

DX Latest Social Stream


Loading social stream, please wait...

View Full DX Social Stream

Latest DX News From Around the Web

Below are the latest news stories about DYNEX CAPITAL INC that investors may wish to consider to help them evaluate DX as an investment opportunity.

Oil retreats amid uncertainty over debt ceiling talks

Investing.com -- Oil prices retreated in early Asian trade on Monday, extending losses into a third session as markets awaited more progress in negotiations over the U.S. debt ceiling, while focus also remained on potential supply disruptions in North America.

Yahoo | May 21, 2023

Gold ends above $1,980, surviving bruising week on extended U.S. debt drama

Investing.com -- The U.S. debt drama is flashing red again, helping gold bulls see green.

Yahoo | May 19, 2023

Dollar at near 2-month high on hawkish Fedspeak, debt ceiling optimism

Investing.com-- The dollar rose to a near two-month high against a basket of currencies on Friday, boosted by hawkish comments from Federal Reserve officials and growing optimism over debt ceiling negotiations in Washington.

Yahoo | May 19, 2023

Oil rises on debt ceiling optimism, set to snap 4-week losing spree

Investing.com -- Oil prices rose in Asian trade on Friday, and were on course to settle higher after a volatile week as optimism over raising the U.S. debt ceiling largely offset fears of bloated supply and worsening economic conditions.

Yahoo | May 18, 2023

Oil creeps lower before more cues on U.S. debt ceiling, economic health

Investing.com -- Oil prices edged lower on Thursday after logging sharp gains in the prior session as markets awaited more cues on the potential lifting of the U.S. debt ceiling, with a slew of economic and monetary policy indicators lined up for later in the week.

Yahoo | May 17, 2023

Read More 'DX' Stories Here

DX Price Returns

1-mo -1.29%
3-mo -10.28%
6-mo -8.96%
1-year -22.87%
3-year 17.36%
5-year 0.44%
YTD -7.39%
2022 -15.39%
2021 2.25%
2020 17.09%
2019 11.12%
2018 -8.46%

DX Dividends

Ex-Dividend Date Type Payout Amount Change
Loading, please wait...
View Full DX Dividend History

Continue Researching DX

Here are a few links from around the web to help you further your research on Dynex Capital Inc's stock as an investment opportunity:

Dynex Capital Inc (DX) Stock Price | Nasdaq
Dynex Capital Inc (DX) Stock Quote, History and News - Yahoo Finance
Dynex Capital Inc (DX) Stock Price and Basic Information | MarketWatch

Get Free Updates

Join thousands of investors who get the latest news, insights and top rated picks from StockNews.com!