Ebix, Inc. (EBIX): Price and Financial Metrics


Ebix, Inc. (EBIX): $13.48

0.11 (+0.82%)

POWR Rating

Component Grades

Growth

S

Value

I

Momentum

G

Stability

N

Sentiment

U

Quality

P

EBIX POWR Grades

  • EBIX scores best on the Value dimension, with a Value rank ahead of 93.69% of US stocks.
  • EBIX's strongest trending metric is Quality; it's been moving up over the last 177 days.
  • EBIX ranks lowest in Growth; there it ranks in the 3rd percentile.

EBIX Stock Summary

  • EBIX INC's stock had its IPO on March 26, 1990, making it an older stock than 86.24% of US equities in our set.
  • With a price/earnings ratio of 6.15, EBIX INC P/E ratio is greater than that of about just 16.48% of stocks in our set with positive earnings.
  • EBIX's price/sales ratio is 0.38; that's higher than the P/S ratio of just 13.58% of US stocks.
  • Stocks with similar financial metrics, market capitalization, and price volatility to EBIX INC are KODK, CAE, BC, SANW, and THMO.
  • Visit EBIX's SEC page to see the company's official filings. To visit the company's web site, go to www.ebix.com.

EBIX Valuation Summary

  • In comparison to the median Technology stock, EBIX's EV/EBIT ratio is 60.21% lower, now standing at 7.6.
  • Over the past 243 months, EBIX's price/earnings ratio has gone up 1.5.

Below are key valuation metrics over time for EBIX.

Stock Date P/S P/B P/E EV/EBIT
EBIX 2023-03-21 0.4 0.7 6.9 7.6
EBIX 2023-03-20 0.4 0.7 6.6 7.5
EBIX 2023-03-17 0.4 0.7 6.5 7.4
EBIX 2023-03-16 0.4 0.7 7.1 7.7
EBIX 2023-03-15 0.4 0.7 6.9 7.6
EBIX 2023-03-14 0.5 0.8 7.0 8.1

EBIX Growth Metrics

    Its year over year net cashflow from operations growth rate is now at -16.25%.
  • Its year over year net income to common stockholders growth rate is now at -26.28%.
  • Its 2 year revenue growth rate is now at 72.2%.
Over the past 33 months, EBIX's revenue has gone up $481,150,000.

The table below shows EBIX's growth in key financial areas (numbers in millions of US dollars).

Date Revenue Operating Cash Flow Net Income to Common Stock
2022-09-30 1,061.765 74.738 72.209
2022-06-30 995.597 69.255 69.41
2022-03-31 991.138 66.46 65.788
2021-12-31 994.938 69.471 68.188
2021-09-30 950.227 68.418 72.26
2021-06-30 912.796 63.617 81.491

EBIX's Quality Factors

The “Quality” component of the POWR Ratings focuses on 31 different factors of a companies fundamentals and operational strength. Here are some key insights as we drill into the specifics of these quality attributes.
  • EBIX has a Quality Grade of C, ranking ahead of 33.35% of graded US stocks.
  • EBIX's asset turnover comes in at 0.586 -- ranking 48th of 83 Computers stocks.
  • CERN, TLS, and MITK are the stocks whose asset turnover ratios are most correlated with EBIX.

The table below shows EBIX's key quality metrics over time.

Period Asset Turnover Gross Margin ROIC
2021-06-30 0.586 0.304 0.126
2021-03-31 0.502 0.349 0.132
2020-12-31 0.408 0.451 0.137
2020-09-30 0.357 0.553 0.140
2020-06-30 0.349 0.604 0.140
2020-03-31 0.364 0.624 0.149

EBIX Price Target

For more insight on analysts targets of EBIX, see our EBIX price target page. And for a list of of all stocks sorted by upside potential based on analyst target price, see our Top Price Target page.

Average Price Target $57.75 Average Broker Recommendation 1.25 (Strong Buy)

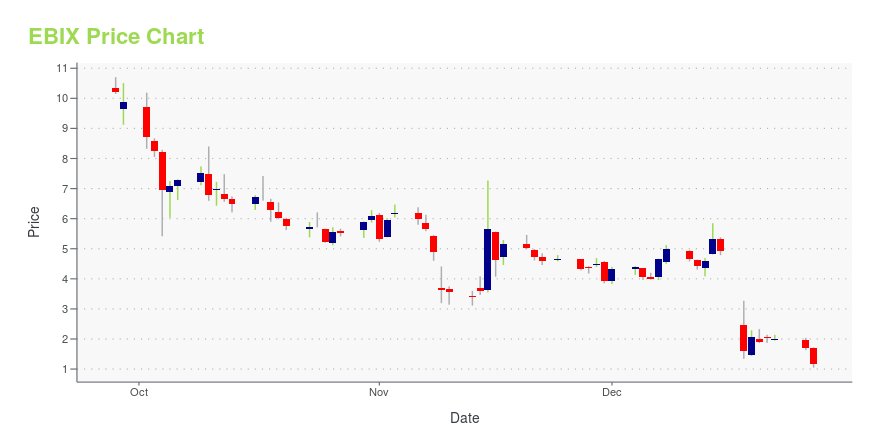
EBIX Stock Price Chart Interactive Chart >

Price chart for EBIX

EBIX Price/Volume Stats

Current price $13.48 52-week high $37.87
Prev. close $13.36 52-week low $12.04
Day low $13.33 Volume 6,121
Day high $13.58 Avg. volume 380,037
50-day MA $17.13 Dividend yield 2.29%
200-day MA $19.54 Market Cap 416.57M

Ebix, Inc. (EBIX) Company Bio


Ebix Inc. is a supplier of on-demand software and e-commerce services to the insurance, financial and healthcare industries, providing end-to-end solutions ranging from infrastructure exchanges, carrier systems, agency systems and risk compliance solutions to custom software development for all entities involved in the insurance industry. The company was founded in 1976 and is based in Atlanta, Georgia.


EBIX Latest News Stream


Event/Time News Detail
Loading, please wait...

EBIX Latest Social Stream


Loading social stream, please wait...

View Full EBIX Social Stream

Latest EBIX News From Around the Web

Below are the latest news stories about EBIX INC that investors may wish to consider to help them evaluate EBIX as an investment opportunity.

Ebix, Inc. (NASDAQ:EBIX) Q4 2022 Earnings Call Transcript

Ebix, Inc. (NASDAQ:EBIX) Q4 2022 Earnings Call Transcript March 15, 2023 Operator: Ladies and gentlemen, good morning. My name is Abby and I will be your conference operator today. At this time, I would like to welcome everyone to the Ebix Incorporated Annual Results Investor Conference Call. Today’s conference is being recorded and all lines […]

Yahoo | March 20, 2023

Q4 2022 Ebix Inc Earnings Call

Q4 2022 Ebix Inc Earnings Call

Yahoo | March 16, 2023

Why Ebix Shares Are Plunging Today

Ebix, Inc (NASDAQ: EBIX) reported a fourth-quarter FY22 revenue decline of 4% year-on-year to $255.21 million, beating the consensus of $251.04 million. The decrease is primarily due to the negative effect of the substantial strengthening of the U.S. dollar. On a constant currency basis, Q4 2022 revenues increased 5% Y/Y. Segments: EbixCash Exchanges revenue declined by 6% Y/Y to $188.9 million, Insurance Exchanges revenue declined by 1% Y/Y to $43.8 million, and RCS revenue was flat Y/Y to $22.

Yahoo | March 15, 2023

Ebix Reports Record Revenues of $1.1 Billion, 2022 Operating Income of $120.3 Million with 1% YoY Growth, Operating Cash Flow of $32.5 Million in Q4 2022 and $77.6 Million for Fiscal Year 2022, with 12% YOY Growth

JOHNS CREEK, Ga., March 15, 2023 (GLOBE NEWSWIRE) -- Ebix, Inc. (NASDAQ: EBIX), a leading international supplier of on-demand software and e-commerce services to the insurance, financial services, travel, healthcare, and e-learning industries today announced the following results for the quarter ended December 31, 2022 and the full year results for 2022: Revenues of $255.2 million and $1.05 billion for Q4 2022 and fiscal year 20222022 GAAP operating income of $120.3 million and Non-GAAP operatin

Yahoo | March 15, 2023

Ebix Hosts Q4 Investor Call Wednesday, March 15, 2023 at 11:00 a.m. ET

JOHNS CREEK, Ga., March 07, 2023 (GLOBE NEWSWIRE) -- Ebix, Inc. (NASDAQ: EBIX), a leading international supplier of on-demand software and e-commerce services to the insurance, financial services, travel, healthcare and e-learning industries, today announced that the Company will report its 2022 fourth quarter and full year results on Wednesday, March 15, 2023, and will host an investor conference call at 11:00 am ET on the same day to discuss the Company's performance. The call is open to the p

Yahoo | March 7, 2023

Read More 'EBIX' Stories Here

EBIX Price Returns

1-mo -22.44%
3-mo -32.46%
6-mo -28.66%
1-year -61.74%
3-year -13.05%
5-year -81.08%
YTD -32.46%
2022 -33.55%
2021 -19.07%
2020 14.97%
2019 -20.95%
2018 -46.06%

EBIX Dividends

Ex-Dividend Date Type Payout Amount Change
Loading, please wait...
View Full EBIX Dividend History

Continue Researching EBIX

Want to see what other sources are saying about Ebix Inc's financials and stock price? Try the links below:

Ebix Inc (EBIX) Stock Price | Nasdaq
Ebix Inc (EBIX) Stock Quote, History and News - Yahoo Finance
Ebix Inc (EBIX) Stock Price and Basic Information | MarketWatch

Get Free Updates

Join thousands of investors who get the latest news, insights and top rated picks from StockNews.com!


Page generated in 0.9868 seconds.